
Blog
Case studies, strategies, and ideas shaping modern technology.
Empowering Clients with Smarter Cloud Monitoring and Self-Service Infrastructure

Article Written by…
- Alex Bailey, DevOps Engineer at Mesoform
- Nipa Patel, Business Operations Manager at Mesoform
At Mesoform, we continuously work to improve how cloud infrastructure is deployed, monitored and managed. As organisations adopt increasingly complex cloud environments, it becomes more important to ensure that systems are not only running, but also observable, secure and easy for teams to manage.
Monitoring is often treated as something that is configured after infrastructure has been deployed. In practice, this can lead to inconsistent setups, manual configuration work and delays before systems are properly monitored.
Our recent work focuses on embedding monitoring directly into the infrastructure platform itself. By automating monitoring deployment and configuration, and by introducing clearer access controls, we are building a system that allows teams to deploy infrastructure that is automatically observable from the moment it is created.
This work brings together several key concepts, including organisational units, GitOps-driven infrastructure management, automated monitoring deployment, and secure self-service configuration.
Structuring Infrastructure with Organisational Units
A central concept in this architecture is the use of organisational units.
An organisational unit represents a logical part of a business structure within the infrastructure platform. In practice, this could represent a department, a service, or a specific application project.
For example:
- A company may have organisational units for engineering, operations or data teams
- Within those, there may be organisational units for individual services or products
- Each project can have its own infrastructure, configuration and monitoring
This creates a structure that mirrors the way organisations actually operate.
An OrganizationalUnit is a technical representation of those business units — for us, this is a Kubernetes Operator and is the primary resource control mechanism on our IDP by managing namespaces in a much more powerful way.
When an OrganizationalUnit is deployed, it performs several automated actions within the platform. It creates a hierarchical (to match your business org structure) Kubernetes namespace and sets up access controls around it. If configured to do so, it also establishes a connection to a source repository that contains any cloud infrastructure (defined as Kubernetes YAML) manifests we want to deploy to this namespace.
These repositories are synchronised using GitOps principles. Infrastructure configuration is stored in version-controlled repositories, and the platform continuously synchronises the declared configuration with the running environment. When changes are made to the repository, they are automatically applied to the infrastructure.
This approach ensures infrastructure changes are traceable, reproducible and easy to manage at scale.
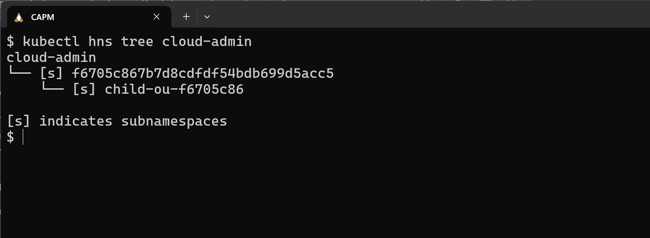
Namespace structure from OrganizationaUnits
Automating Monitoring Deployment
One of the goals of this work is to ensure that monitoring is available from the moment infrastructure is deployed.
When a new cloud environment (GCP Project, AWS Member Account, Azure Subscription), internally referred to as a CloudSpace, is created, the platform can automatically deploy a centralised monitoring stack alongside the infrastructure. This monitoring stack provides the core functionality required to collect metrics, track system health and generate alerts across multiple cloud providers.
The monitoring stack itself is based on a dedicated monitoring platform which runs on the internal developer platform, so that it is cloud-agnostic. Once deployed, it becomes responsible for observing resources across the organisation, but configurable by any teams managing a CloudSpace through self-service.
Rather than requiring administrators to manually configure monitoring each time a new project is created, the system can automatically register new resources with the monitoring platform and apply appropriate monitoring templates.
This allows infrastructure teams to ensure consistent monitoring across multiple environments without additional manual effort.
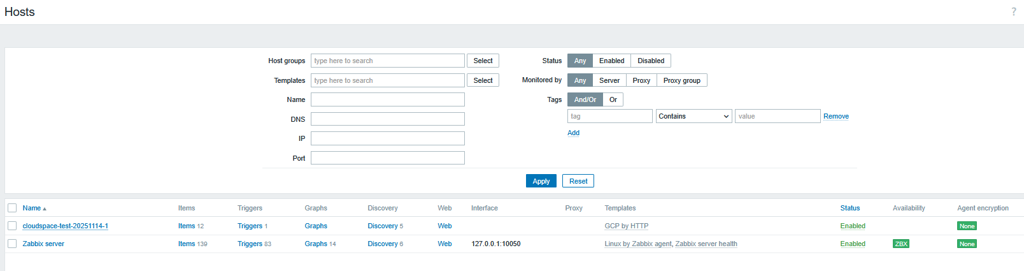
Screenshot of host monitoring the project created by Cloudspace
Separating Deployment and Configuration
A key architectural principle used in this work is separation of concerns.
Traditionally, monitoring platforms are deployed and then configured manually through their user interface. Administrators log in and configure hosts, templates and permissions directly within the application.
While this works for smaller environments, it does not scale well and can introduce inconsistencies between deployments.
Instead, we separate the monitoring platform into three logical components:
1. Monitoring Stack
The monitoring stack is the core monitoring application. It provides the pre-defined templates of dashboards, metrics collection, alerting and data storage that make monitoring possible.
2. Admin Configurator
The admin configurator performs system-level configuration tasks that require elevated permissions. This includes creating user roles, configuring system settings and defining structures such as host groups.
3. Standard Configurator
The standard configurator handles operational configuration tasks such as registering hosts and applying monitoring templates to infrastructure resources.
By separating these responsibilities, we ensure that high-privilege administrative tasks are handled by dedicated components, while routine configuration tasks can be automated safely.
This also allows monitoring configuration to be managed through code rather than manual user interface changes.
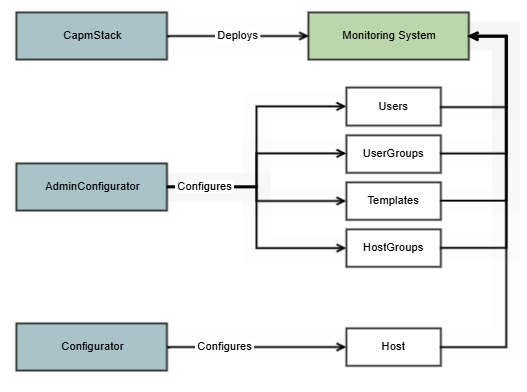
Diagram showing monitoring stack with admin and standard configurators
Identity and Access Management
Monitoring systems often require careful control over who can perform which actions.
Some tasks require elevated permissions. For example, creating user roles or defining host groups typically requires administrative privileges. However, many day-to-day tasks, such as connecting new infrastructure resources to monitoring, do not require this level of access.
To address this, the system automatically creates different users and roles with carefully defined permissions.
Administrative components perform tasks that require higher levels of privilege. Standard configuration components operate with more limited permissions and are responsible for connecting infrastructure resources to the monitoring system.
This separation allows teams to configure monitoring for their own services while protecting critical system settings from accidental changes.
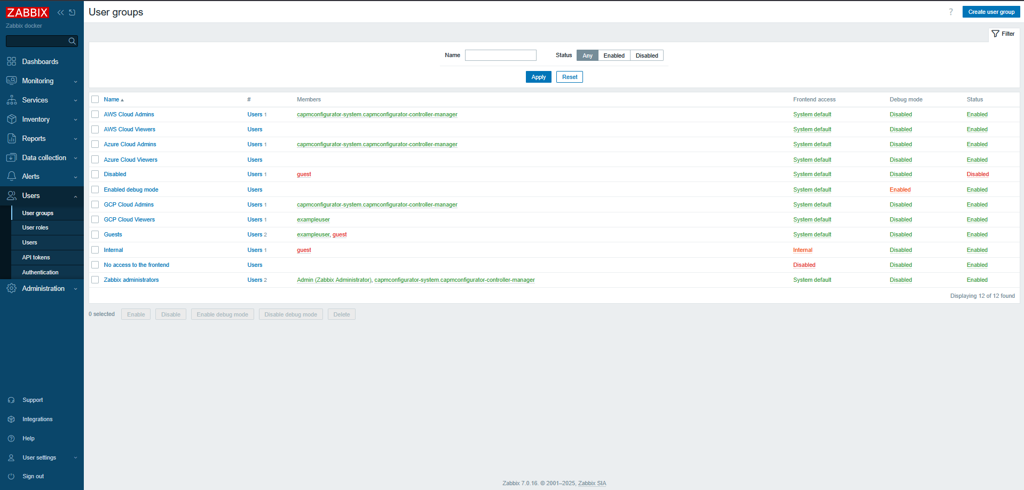
Screenshot of users present in UserGroups
Zero-Touch Password Management
Security is another important aspect of the platform.
To reduce risk and simplify credential management, we use a principle known as zero-touch passwords.
Instead of administrators manually creating and distributing passwords, credentials are automatically generated by the system when access is requested. These credentials are securely stored and made available only to the user who requested them.
In production environments, even platform administrators do not see the password itself. The system simply generates it, stores it securely and provides access to the appropriate user.
This approach significantly reduces the risk of credential exposure and removes the need for manual password management.
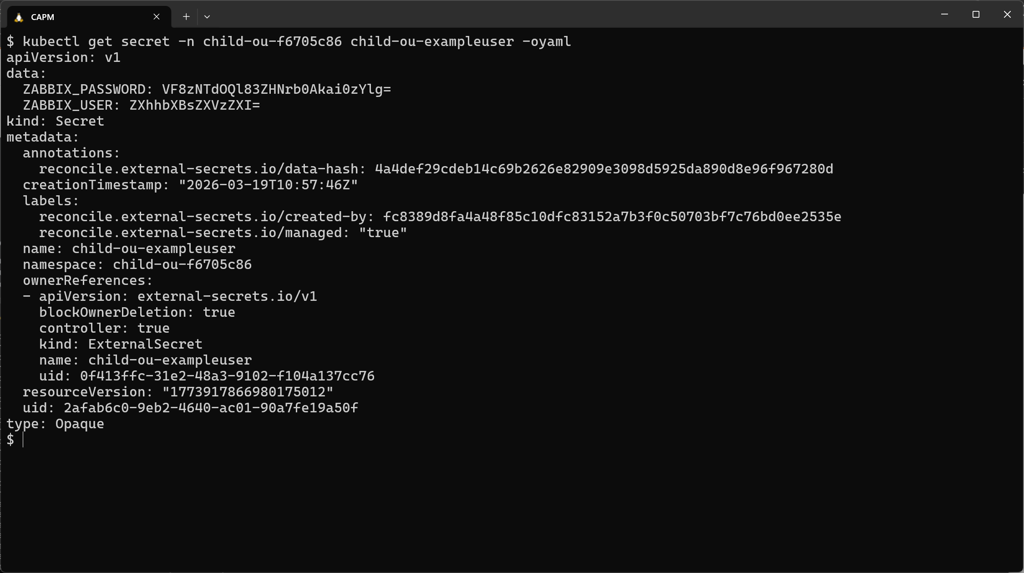
Screenshot of secret holding generated password for exampleuser
Monitoring Through Configuration
Another important capability of the system is the ability to define monitoring directly within infrastructure configuration.
When creating a cloud environment, users can specify which services should be monitored. For example, monitoring may be enabled for compute resources within a CloudSpace. For example, let’s say our CloudSpace operator is managing a Google Cloud Project. Once the monitoring flag is enabled, the system will automatically:
- Register the cloud project as a monitored host
- Establish a connection to the monitoring metrics API to collect basic Project details
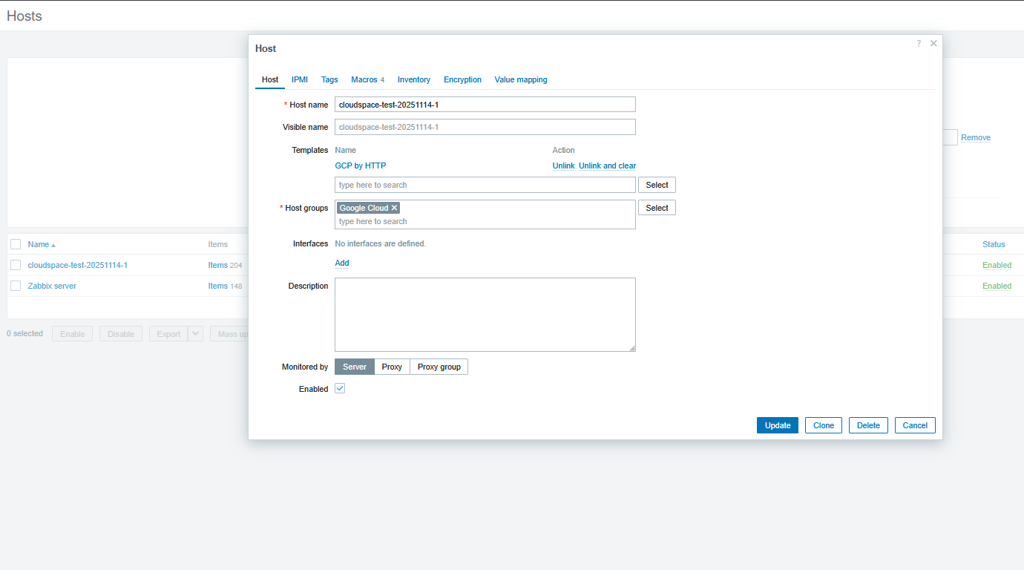
Screenshot showing CloudSpace Host with GCP template enabled
Then, if the team adds GCE to the list of monitored services, the operator will then
- Apply monitoring templates appropriate to those resources
- Begin collecting metrics and trigger notifications for any breaches of pre-defined alert thresholds
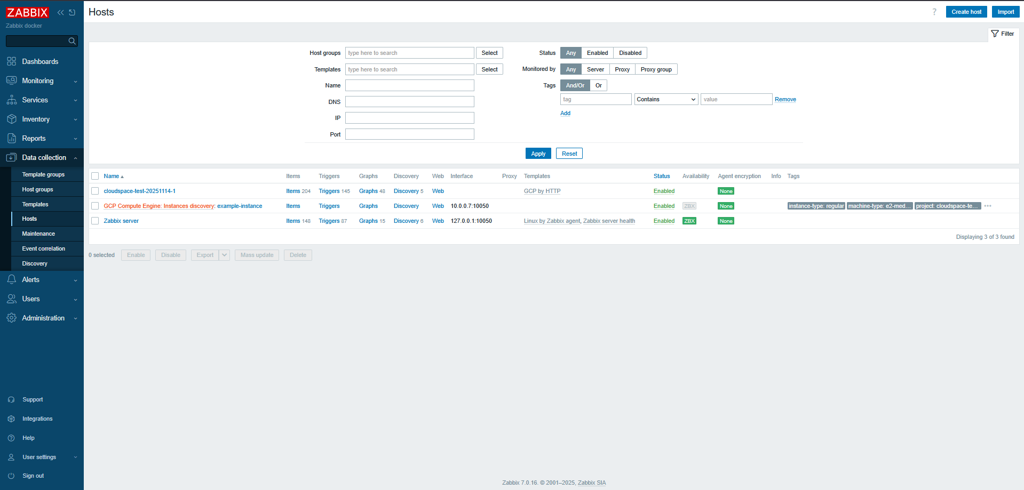
Screenshot of discovered host for compute instance in CloudSpace project
This approach allows monitoring to scale automatically alongside infrastructure.
As new resources are deployed, they can be discovered and monitored without requiring additional manual configuration.
Enabling Self-Service Monitoring
The long-term goal of this work is to enable self-service monitoring within the platform.
Development teams should be able to deploy infrastructure and automatically gain visibility into its performance and health. At the same time, platform teams must maintain security, governance and operational consistency.
By combining GitOps infrastructure management, automated monitoring deployment, strict identity controls and configuration-driven monitoring, the platform enables teams to manage their own monitoring requirements safely.
Users can define what they want to monitor while the platform handles the complexity of deploying and managing the monitoring system itself.
Building More Observable Cloud Platforms
These improvements form part of Mesoform’s broader effort to create cloud platforms that are automated, secure and highly observable.
By embedding monitoring into infrastructure workflows rather than treating it as a separate activity, organisations can ensure that every environment is consistently monitored from the moment it is created.
This approach improves operational visibility, reduces manual configuration and helps teams respond more quickly when issues occur.
Learn More
If you would like to learn more about how Mesoform is improving automated monitoring and cloud infrastructure management, get in touch to discuss your requirements or arrange a demonstration.
