
Blog
Case studies, strategies, and ideas shaping modern technology.
The Concierge Paradigm

Containers have been around now for quite a few years. We can trace the concept back to 1979 and the introduction of the chroot system call but it wasn't until BSD Jails, Solaris Zones and LXC in 2000, 2004 and 2008 when the technology started to mature. Zones in particular became incredibly stable very early on. With a very high level of isolation and performance, capable of multi-tenancy systems.
With the rise of VMWare and IaaS providers like AWS, container technologies took a back seat as the masses embraced cloud computing. Containers weren't fully able to satisfy the demands of ephemeral and dynamically scaling systems. However, in more recent years Docker has revitalised the interest back in this technology by introducing the idea of application containers and a powerful set of tools and infrastructure for maintaining container images.
Expanding the benefits beyond performance and resource utilisation gains, Docker improved standardisation, configuration management and portability, meaning containers are fast becoming the next hot technology (if they're not already). However, they do maintain some challenges in the Cloud. Specifically monitoring, orchestration (e.g. automated scheduling and auto-scaling) and service discovery are an additional burden.
To solve these issues whole new solutions have arisen. Technologies like Kubernetes and Mesos have been developed to handle the orchestration and scheduling of containers. Although they introduce some of their own issues (complexity, automation, customisation and deployment of varying applications and cloud providers, engineer up-skilling, support and upgrades dependency introduction), they are powerful technologies and do a good job.
There are many well written articles (download the linked document from Rancher's article) and quick set up guides for these systems, so I'm going to step aside from them and look at an alternative method - one which utilises a system already incumbent in most environments and a couple of very simple caretaker scripts. We call it the Concierge Paradigm. So if you've struggled with some of the additional challenges of running containers in the cloud brings, or you're just interested in different points of view, read on, I'm sure that you'll find this interesting.
The Concierge Paradigm idea was borne over time but initially came from challenges we had by working out how to operate scalable and enterprise-grade application containers. This meant monitoring, logging, deploying, scaling, load-balancing and service discovery. We needed to do this both on-premise and in AWS. We were running some docker tasks in ECS and a Kubernetes and CoreOS cluster on-premise but we hadn't chosen these by researching different options, they were pretty much the first options we came across. We'd felt the difficulties of our decision, so started to look out to the wider community at other options. This is when I came across the Autopilot Pattern developed by some clever cookies at Joyent.
Joyent have been running a scalable, container-native infrastructure for years before anyone else, so it wasn't a surprise that they came up with a simple and elegant solution to container orchestration. The general premise of the Autopilot Pattern is that instead of maintaining complex frameworks to manage your containers, you simply strip the infrastructure down to its most essential component - service discovery (Consul, Etcd), then keep the orchestration logic with the application code. This of course passes the responsibility back to the developer, but who knows better than they how the application should run. Furthermore, the logic can be kept in the same source code repository as the application code rather than for some other external system. Below is a workflow diagram for Containerpilot (previously Containerbuddy), which is small piece of code that runs inside the container and is the only other component needed in the pattern.
Personally, I found the idea beautifully simple and very interesting for our particular problems but it has many other benefits beyond its simplicity, including things like:
- It's scheduler agnostic:
- it will work with Kubernetes, Mesos, Swarm or anything else
- Applications don't have to be (re)written for a particular framework:
- Containerpilot manages things so even more traditional applications will work easily
- Orchestration is then app-centric rather than being maintained in a separate system, probably even by a separate team:
- cutting out a lot of ticket raising and requests for trivial changes
- Less management by providing automation of common operations:
- this automation code can be kept with the application code so everyone knows where to find the docs
- Less setup:
- Getting a production ready infrastructure is very quick because there's no need to build out some complex orchestration infrastructure
Further to managing the lifecycle of the application, Containerpilot also has the ability to run coprocesses. Although Docker recommend running a single service inside of a container, I'm yet to find a really compelling argument for literally running one process as opposed to a single service with supporting processes. For example, it can also be used for running a monitoring agent (Containerpilot has the ability to open up a telemetry endpoint but there are a number of benefits to running an agent which I will elaborate on later). It's here that Concierge Paradigm began to develop.
Operating pains
In our bare-metal and VMWare & AWS VMs implementations we used a combination of Zabbix, Splunk (although we deprecated this ages ago due to costs and experience), Papertrail, ElasticStack (ELK) and Librato. All with a particular function and at different stages of life. Logging was handled through docker log drivers and we were moving to pumping everything into ElasticStack (Papertrail had a quick integration but was limited). Librato, the same had a much nicer user experience than Zabbix, it just wasn't as functional, nor incumbent; and primarily it was missing event management feature which Zabbix does so well.
On the Zabbix side we ran the Zabbix Agent on all of our hosts, which took responsibility for collecting metrics from the OS, applications and any frameworks. Being a Java house JMX and OS were covered off natively by Zabbix. However, as a company we'd made a decision to not open up JMX interfaces (for the Zabbix JMX Gateway) in AWS and chose to use Dropwizard framework to push metrics to Librato. This lead to a problem with capturing such metrics in Zabbix because the delivered object was not one understood by Zabbix. So we chose to use Dropwizard metrics' AdminServlet and used the agent to query this locally and reformat to a JSON object that Zabbix did understand. This allowed us to discover metrics easily by simply querying the endpoint, then capture each metric we wanted in a similar manner using curl from the Zabbix Agent.
This method worked okay for a while but because each metric was queried separately a lot of post processing had to happen and as we scaled down the size of VMs in AWS and increased the number of metrics, we found that we hit a threshold that significantly impacted CPU utilisation. This meant we couldn't capture as many metrics as we wanted; nor as often as we wanted without seriously hammering resources of the host. In some instances we were even forcing the application cluster to scale up due to high CPU utilisation. Later on, another problem arose where we discovered that because there was a time gap between when we collected each metric, we sometimes had a bad windowing issue when we were trying to calculate metrics. For example, we would see spikes of 300% 5XX HTTP response errors because the last value we captured for 5XX was more recent than the total request count metric (particularly when clients were aggressively retrying). This issue wasn't noticed in our Librato push model because a single, snapshot object of all metrics was sent to Librato and the timestamp taken from the time of delivery. It also meant that our containerised applications would be impacted even more seriously if we followed the same approach, so we had to look at other options.
One of the things we did was create our own Zabbix Metrics library for Dropwizard metrics, written by Manish Kumar, with Long Chen. There were other libraries available but they didn't solve discovery well and we felt this important for automation. However, we still needed to be able to monitor container resources, underlying Docker host VMs, middleware, non-Java applications, off-the-shelf products, plus anything we felt needed to be covered off.
From research, it seemed that solving the Docker monitoring problems was best done by either running an agent of some sort on the Docker host VM or running a privileged container that had access to the Docker socket. Neither of which I like much. Partly for the security aspects but also you may not always have access to the underlying machine. Enter Autopilot mode and the Concierge Paradigm.
The Concierge Paradigm
It's probably clear by now that the first thing we did was include a monitoring agent inside the container, under the management of Containerpilot. By doing this, functionality already built into the agent, allowed us to immediately answer a number of questions:
- We could automatically register and monitor new containers
- We could automatically monitor container resources
- We could automatically discover container filesystems (e.g. docker volumes) and network interfaces; and capture their associated metrics.
- Containers could very easily be grouped into services by using information gathered from the container
- Having agents sending data to a centralised monitoring system where their configuration is kept means, that we could programme the agent on-the-fly if we want to add new metrics urgently; and doing so won't necessarily require redeployment of the container.
- Collecting all this together means we have an accurate runtime view of the state of the system as a whole.
- As agents register and deregister (more on this later) we're able to actively track all live and recently terminated (for post humous analysis) assets
- Agents can be used to perform some simple self-healing actions like halting, rebooting, or sending SIGHUP under poor performance or significant errors.
- Using a well established, enterprise grade monitoring platform means that there is no need to create anything new and instant access to already well-defined monitoring for off-the-shelf applications and databases is common
- Code for collecting metrics is loosely-coupled to the application. So developers could keep any custom application metric collection in the same code repository
- Systems administrators could manage non-application monitoring separately allowing separation of concerns around container monitoring.
With previous performance issues in mind, the next step was to work out an efficient way to monitor applications in this environment. Doing so without impacting the limited resources available inside a container caused by machine gun approach of scraping metrics individually. It was thinking about this machine gun way of metric shots compared to the push model - a single, accurate shot to Librato - that started me thinking if the two could be combined.
The Enfield Method
Named after the famous British sniper rifle, the main aim (pun intended) was to provide the most accurate (comparing data or deriving metrics from a single shot containing all metrics returns more accurate results), most effective (one shot, does the job of many), easily deployable on different operations (able to return the same result wherever it's placed) and able to gain immediate feedback on whether we hit the target. This contrasted to the machine gun (common pull method) approach where it takes many shots to hit all metrics (so not very accurate under comparison); or the shotgun (push method) approach where one shot probably does the job but getting immediate feedback on a successful operation is unlikely (at distance... There's no long-range sight on a shotgun... alright, just humour me).
The Concierge Courier
We accomplished our Enfield Method goal by taking advantage of the Zabbix Agent's ability to run a script on the host (although it may be more effective to create a module, writing the script in Python makes the method more agnostic to the monitoring system being used. Plus there is this library to embed a Python interpreter as a module and numerous Zabbix Sender libraries (e.g. py-zabbix) which should improve performance). This script serves only two purposes:
- query some application endpoint (like Dropwizard AdminServlet, Spring Actuator or Prometheus HTTP server) and work out what is available to be monitored and return a list back to the server;
- query the same endpoint for the metrics themselves and fire them off in a single shot to the server and return whether the action was a success.
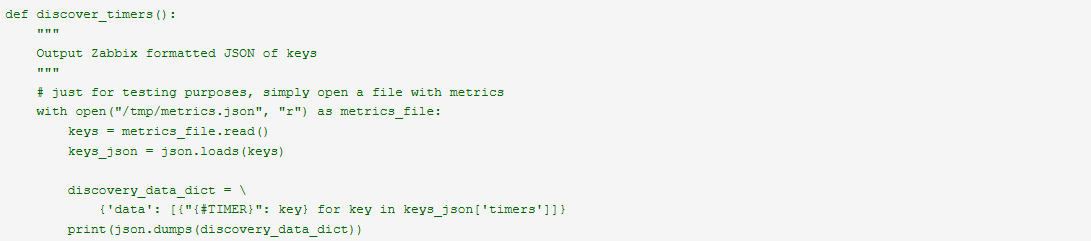
In step one of our example script below, the discover_timers() function in the script (see below) is ran locally by the Zabbix Agent in active mode (i.e. After querying the server to discover what it should monitor, the agent then runs autonomously, collecting metrics and sending them back to the server without the server instigating any action), which subsequently returns a list of available metrics back to the Zabbix Server. The server then uses the list to create a set of trapper item keys that values can be assigned to later, in step two. Using an active agent is predominantly a push based method, but in this case, the agent still has to pull the data from the application endpoint.
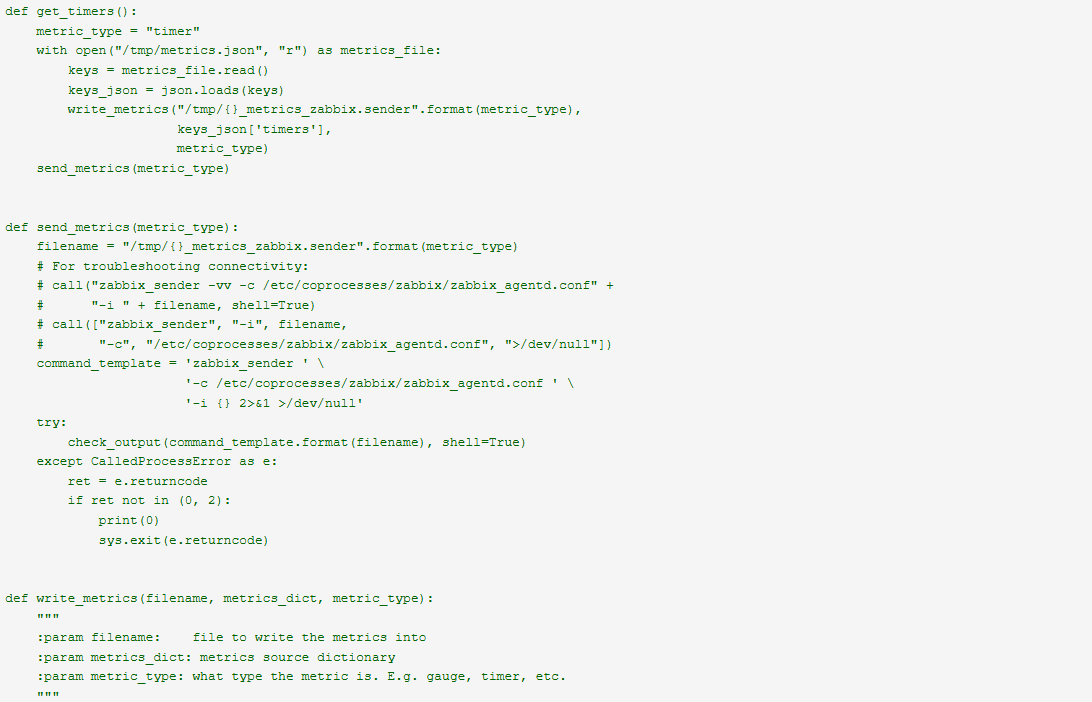
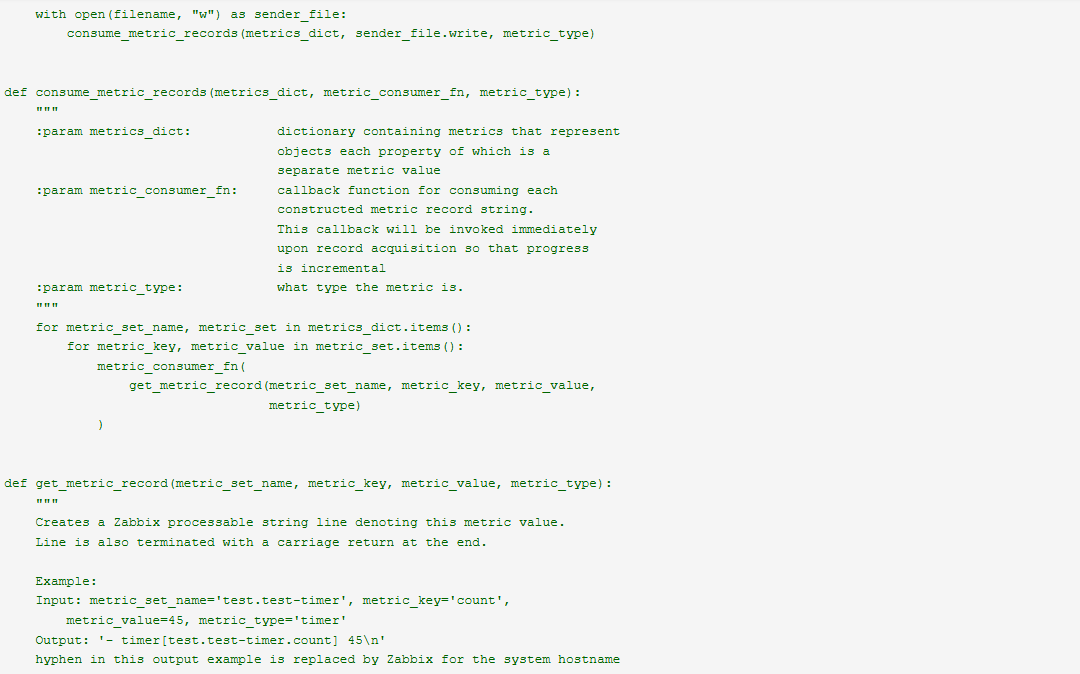
In step two, the agent runs in passive mode (i.e. it waits until the server requests something before performing any action) and upon receiving a request from the server, it runs the get_metric() function of the script. This function queries the same endpoint but this time captures the key-value pairs of metric-name:current-value from the application and pushes them, all in one go to the Zabbix Server. The server then traps the object and assigns each value to the corresponding trapper item key, created in step one. To the original request still needs to receive a value, so the script then returns either:
- the time taken to complete the task (e.g. 1254ms)
- a timeout (-1)
- a failure (0)
The Zabbix Server then records this as another metric. One which we can then add triggers to so that we can be alerted us to possible issues with performance, network partitioning or to understand event changes to the state of running containers. This step is implementing both pull and push based methods.
The Concierge Courier Script
The concierge_courier.py script is called such because it takes responsibility for performing a request from a client to personally collect and return a manifest of metrics:
Or it takes a request from a client to post an important document of data to an agreed delivery point and confirm back to the client that the package was received successfully. For example:
In Zabbix, we use this as follows:
Discovery check:

What we've done here is create a low-level discovery rule that parses values from a list returned by running a special, built-in Zabbix function (or in our case a custom script called concierge_courier.py), filters them, then makes names of things in that list available, as a macro called {#TIMER}, to be interpreted by our item prototypes for creating our metric key names.
Some item prototypes:
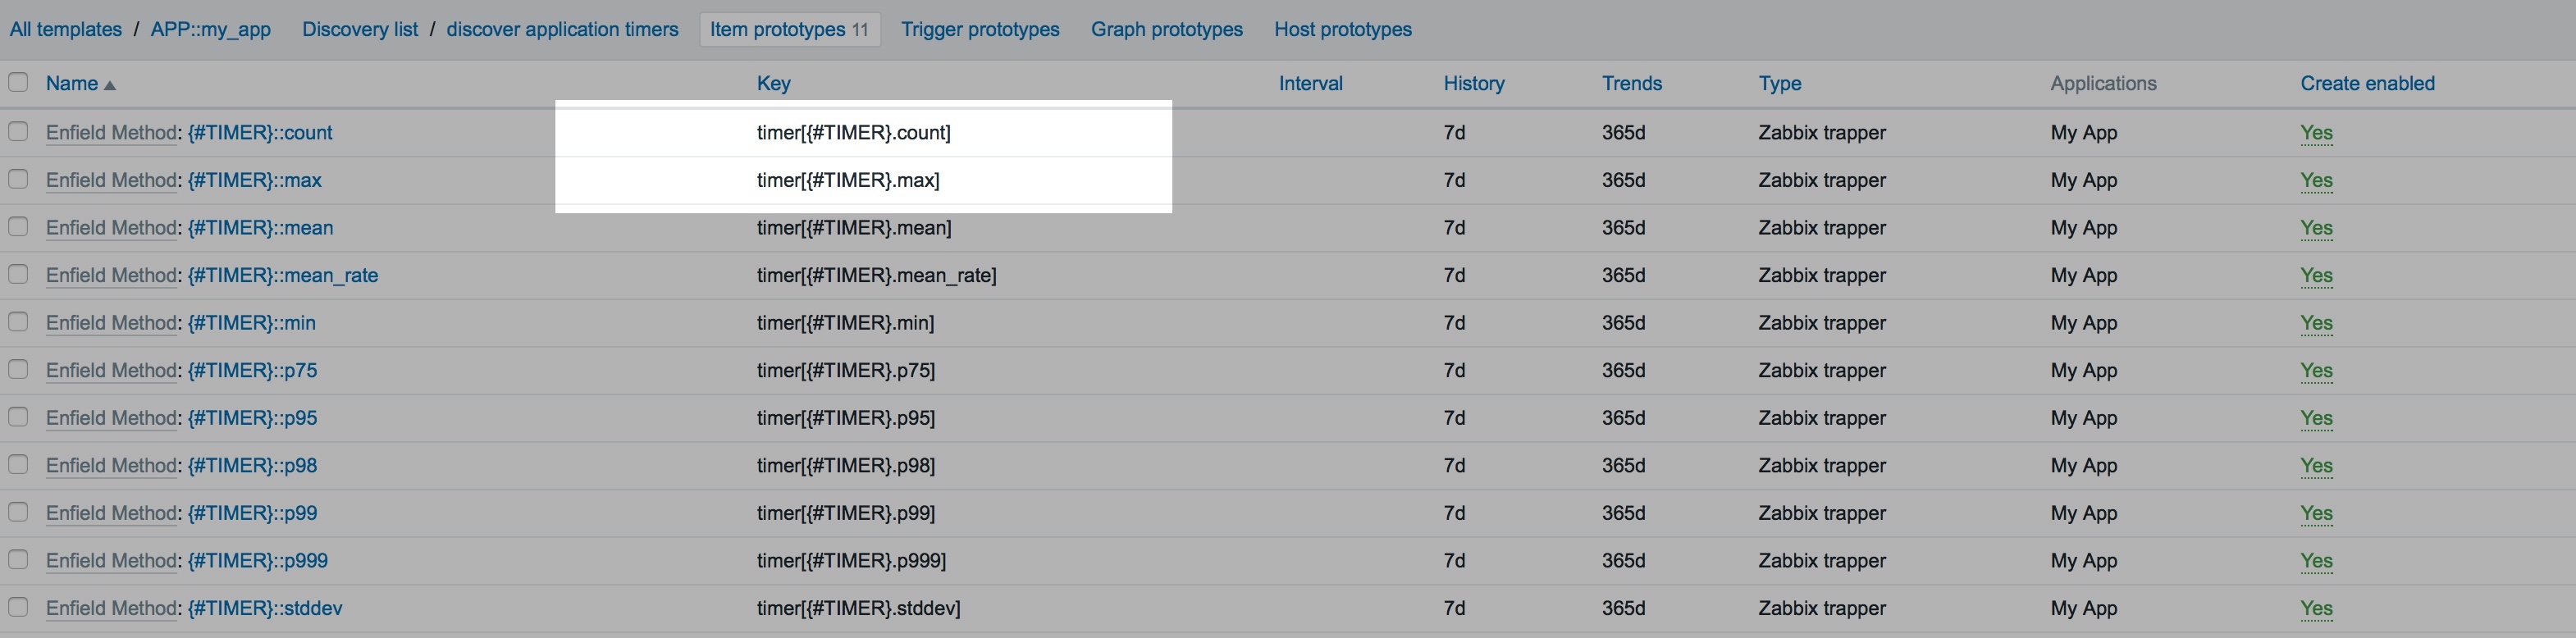
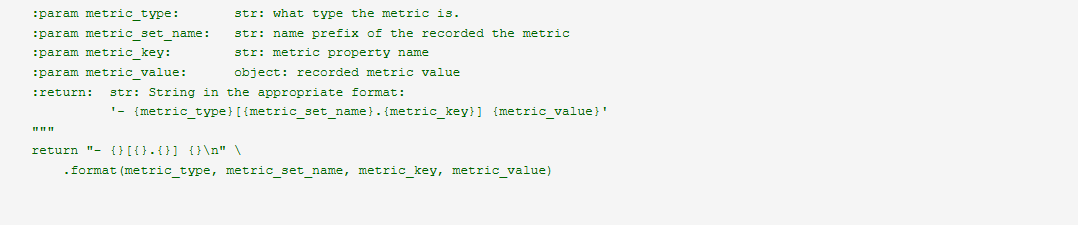
Item prototypes are basically blue prints for dynamically creating metrics based on a given list. In our script, the get_metric_record() creates a set of key-value pairs where "timer[{#TIMER}.max]": 1200 would be expanded to something like "timer[my-awesome-api.response-time.max]": 1200. For every iteration of {#TIMER}, that has a max value, a new trapper item key will be created on the server. E.g. "timer[the-best-api.response-time.max]": 800. Likewise for .count, .p95, .p75, etc.
The static items:

NB. In Zabbix terms, the type (circled in the image above) of Zabbix Agent is a pull based method whereas Zabbix Agent (active) is a push-based method (although it can be a combination of both)
Static items are one which are created manually (although generally templated) and not automatically by some dynamically generated object. Here we have three.
- A basic, pull-based health check where the Zabbix Server calls the Zabbix Agent and confirms that it is still available and responding.
- One to call our script. The Zabbix Server initiates this request to the Agent, whereby it collates all of the key-value pairs and sends them to the trapper items created by the previous discovery rule and item prototypes. This item then plots how long it is taking to complete the task.
- The last item is there to capture the running state of the container (more on this later)
Triggers on the static items:
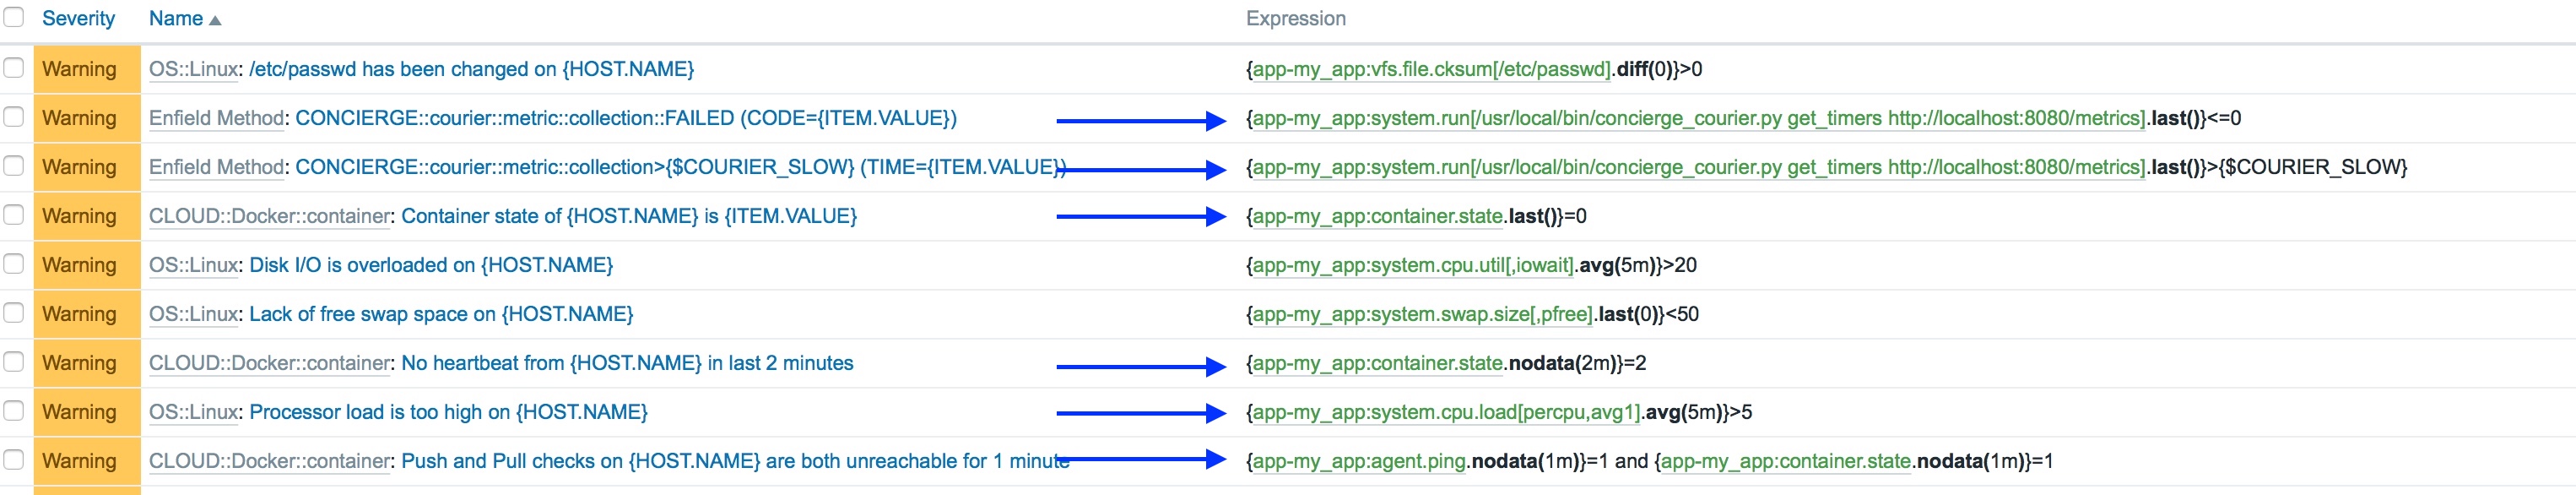
Zabbix provides a set of functions which we can use to test various conditions against our data and record events. I'll quickly explain what's happening here. We will generate an event of some specified severity, and maybe perform some automated action, when:
- The last() value returned by the get_metrics() function of our script is equal to, or less than 0 (a failure)
- The last() value returned by the get_metrics() function of our script is greater than some acceptable time period
- The last() value recorded for container.state is 0
- We've not received any value at all for container.state in the last 2 minutes
- The 1 minute CPU load, averaged over 5 minutes is greater than 5
- We've not received any value at all for container.state, nor have we been able to get a response from the Zabbix Agent in the last 1 minute
Now, we've gained some further advantages:
- Because we're pulling and pushing state information, we have a greater confidence in knowing whether a container is running or has terminated and therefore perform any self-healing or caretaker actions more promptly
- Because we allow metric collection via a pull method, we can easily target an application directly, from any allowable source to inspect its health
- Therefore we can easily simulate a production-like setup on our laptop during development
- Because we're initiating the big metric push with a pull based method, we can time how long it takes to collect metrics from our applications and trigger an alert (and maybe perform some recovery actions) if it takes too long
- Because we push all metrics together, there's no longer a windowing issues when comparing values (e.g. number of HTTP 500 responses / total HTTP requests * 100)
Tracking the Courier
Although in theory, this method should be much more efficient, due to our previous experiences we wanted to prove the performance gains by testing the collection of a very large volume of metrics with as little resources given to the container as possible. In our lab, this is 128MB RAM and 20% of a CPU core.
Test Conditions
To keep things simple metrics were collected from a file rather than running and querying an application endpoint. This also stressed the test even further because we were performing disk IO. We are also writing to disk again and pass this file, for the test, to Zabbix Sender. Clearly there are some optimisations that we can make but this is does highlight performance under restrictive conditions.
Hardware Resources
- Intel NUC5i3RYH
- CPU Type: Intel(R) Core(TM) i3-5010U CPU @ 2.10GHz (3M cache)
- DDR3L
- Physical CPUs: 1
- Total CPU Cores: 4
Container resources
- RAM: 128 MB
- VCPUs: 1
- Swap: 256 MB
- CPU Cap (% CPU): 20
- Max Lightweight Processes: 250
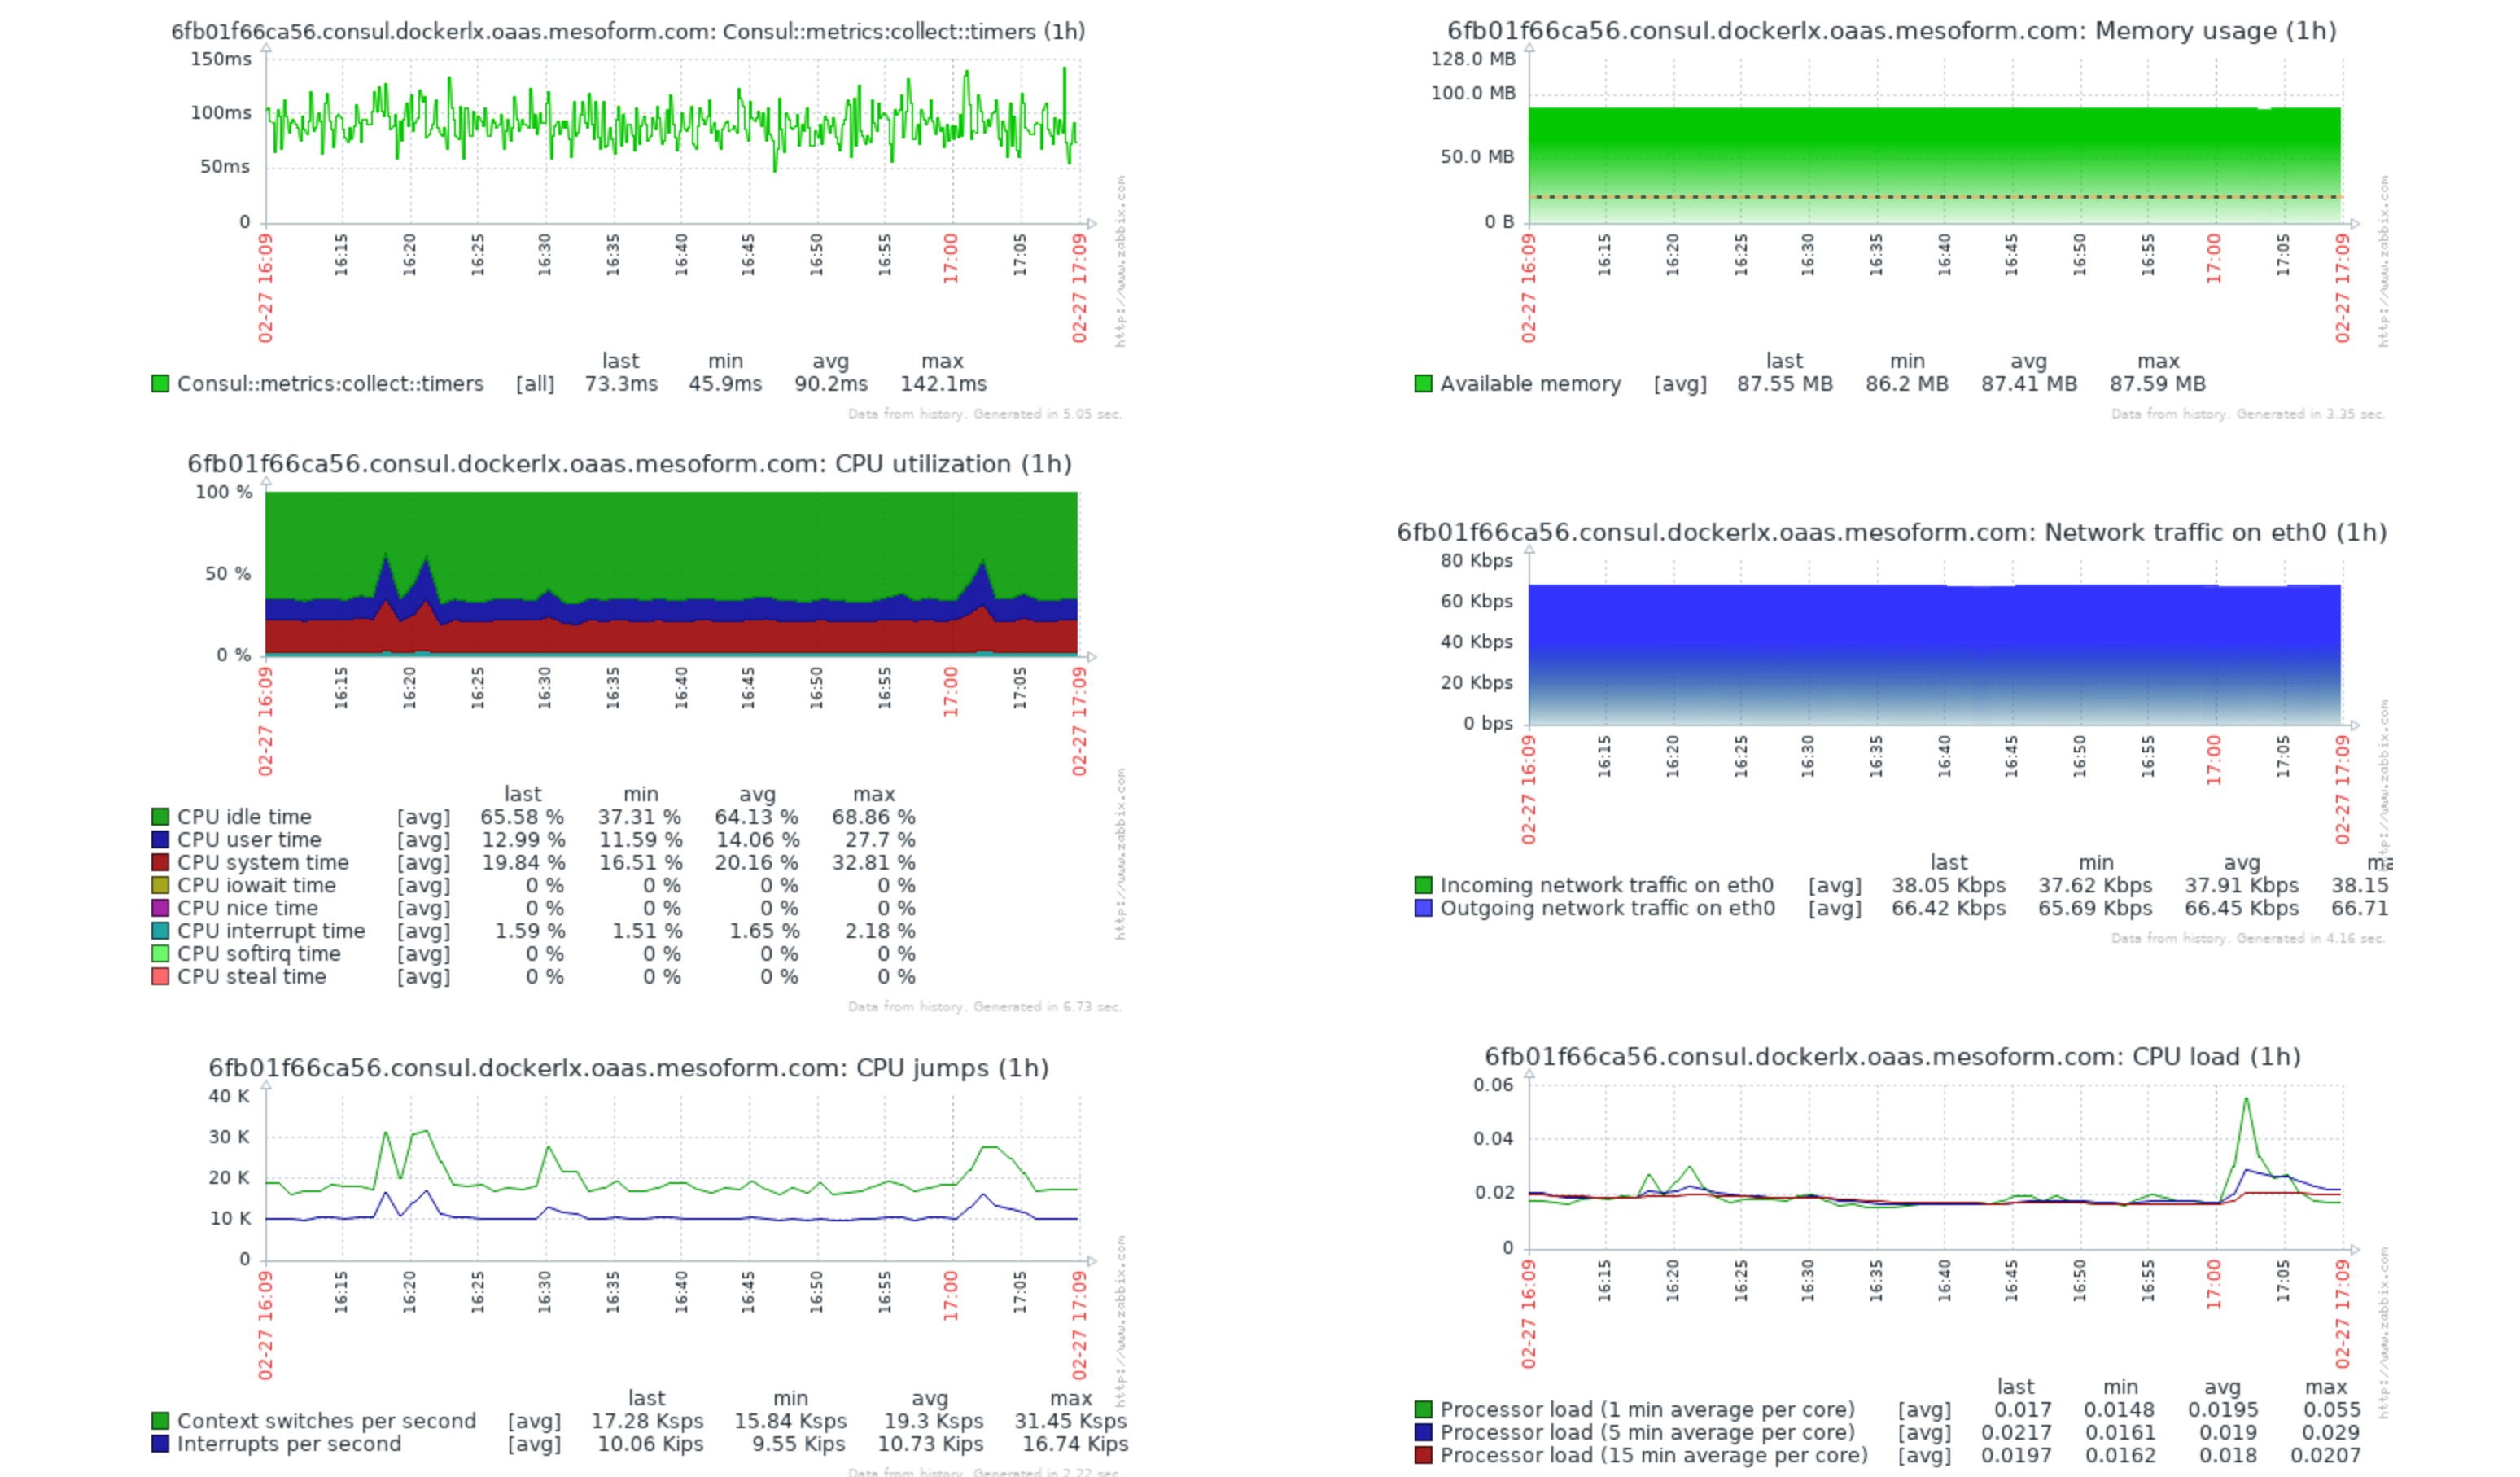
Test 1: Performance at 17 metric delivery
Measurements
- interval between collection: every 30s
- test 1 payload metric count: 17
- test 1 payload size in bytes: 943B
- test 1 metrics trapped (rules around what to trap from the 17 sent): 11
Test 2: Performance at 34,000 metric delivery
Measurements
- interval between collection: every 30s
- test 2 payload metrics sent count: 34,000
- test 2 payload size in bytes: 1.5MB
- test 2 metrics trapped: 22,000
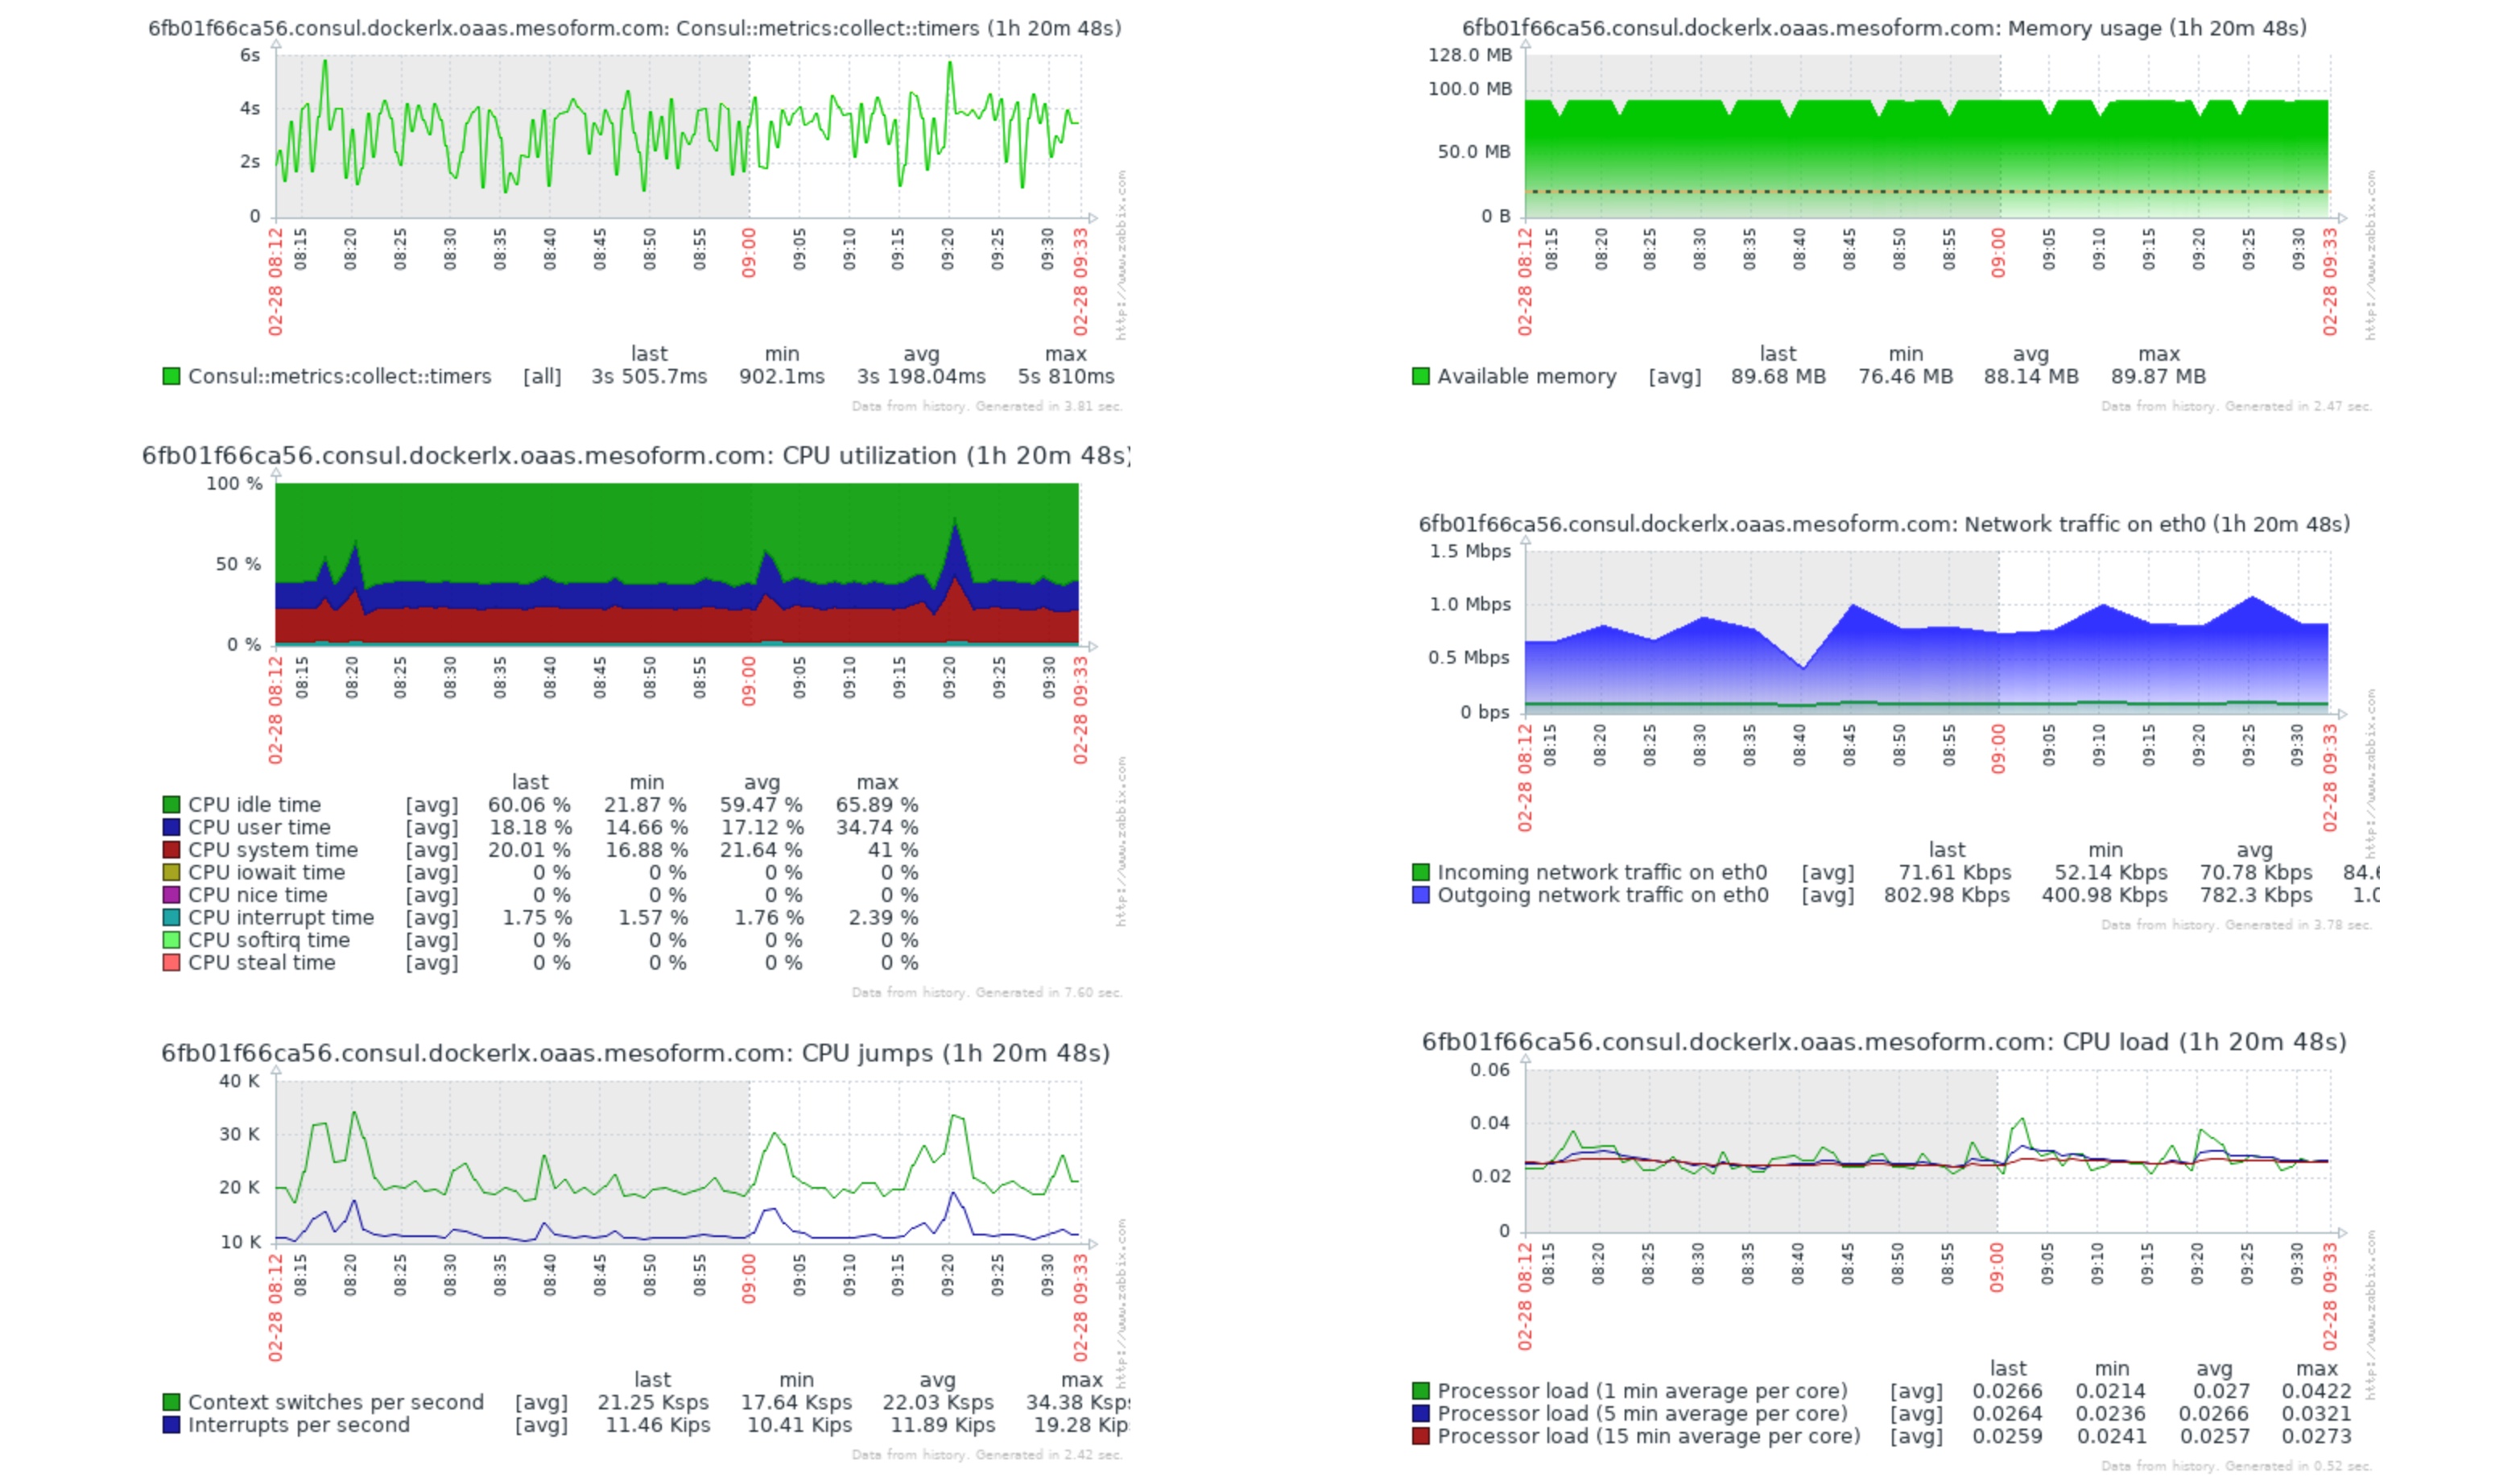
The top left graph is the returned time taken to deliver metrics. All other stats should be self-explanatory and as you can see, even under these extreme conditions, impact is pretty low. Such performance means we can start considering reducing the collection interval to capture metrics at a faster rate. Doing this will then give us a couple of further advantages:
- The more infrequent your metrics are, the more likely the data is smoothed out. Sometimes this can hide real issues, so by increasing the frequency we get improved visibility into potential issues
- Triggers will fire closer to the real-life event happening. So we can act on events requiring intervention sooner.
With further potential optimisations in mind, I was happy enough with these results, so moved on to the next part of the Concierge Paradigm, scheduling.
Concierge Scheduler
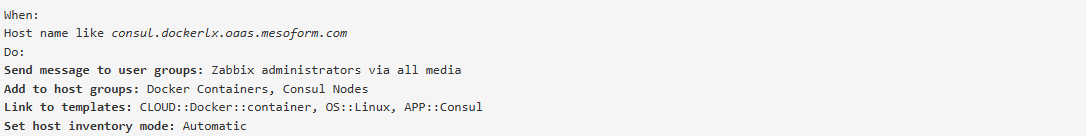
The next part of the Concierge Paradigm concerns how we coordinate the scaling of our services. To do this we need to know the state of each service. As we know, each container in the Concierge Paradigm runs a Zabbix Agent as a coprocess. By doing this we can configure it so that it auto-registers each instance with the Zabbix Server without having to make any changes to the application. It is a simple function that is implemented by configuring an auto-registration action based on either the hostname, some host metadata, or both. In this example I'm using FQDN (which is set by configuring Docker's DNS_DOMAIN parameter) to pass the application name (e.g. Consul) as a sub-domain. This can then be used to assign to relevant templates and include the container in any host groups. For example, the host in the graphs above registered via the following action:
Whilst we attach this monitored host to various templates that will monitor things like standard OS metrics, the Concierge Paradigm requires only a few static items to be configured manually but they should all be templated so will only need creating once. How you organise your template schema is up to you but this is all that is needed:
As mentioned earlier, the container.state trapper item is set to catch container state messages. In the Concierge Paradigm, we accomplish this using Containerpilot tasks and the postStop handler. The purpose of this check is to maintain a heartbeat and running/termination state for each container in our environment. In our example we simply do the following in containerpilot.json
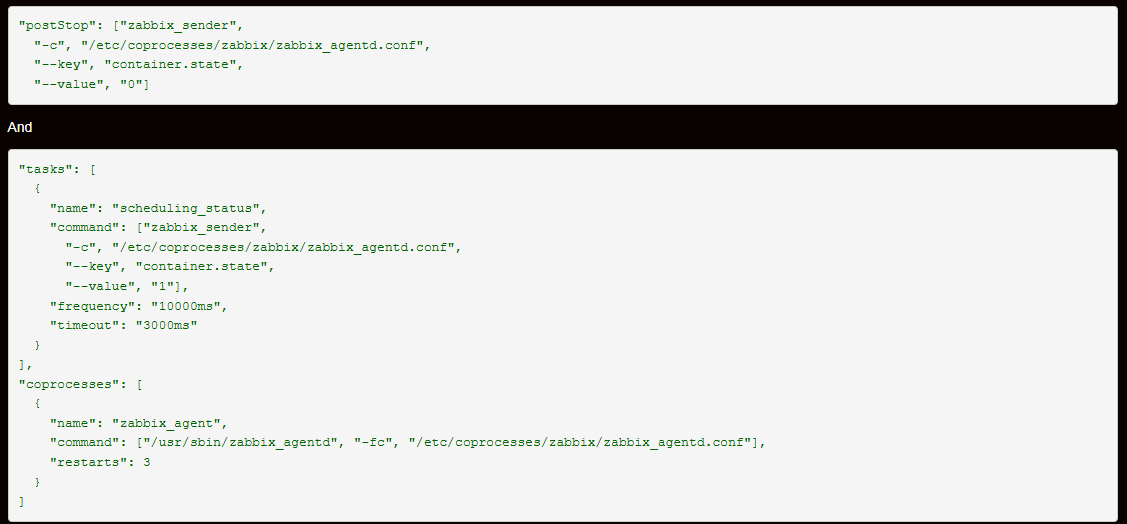
- postStop is a ContainerPilot handler that runs after the application has stopped. In this example, we're sending a zero to this container's container.state item.
- In the tasks section, we're sending a one every ten seconds with a three second limit on how long this task can run for.
- The last part, coprocesses is how we configure the Zabbix Agent to run.
By configuring both container.state and agent.ping, one which is pushed and one which is pulled, we can gain a fair amount of confidence if a container is still running, has exited gracefully or exited catastrophically. Here, container.state acts as our main heartbeat and because it sends a termination value (0), we can react immediately to it exiting. However, being as this is a push based method, we will have to wait for some pre-set period to expire, should there have been some catastrophic failure that didn't allow this exited message to be sent. We can look to reduce this period by adding a combined TTL across both container.state and our pull method metric agent.ping (see previous triggers section). We can then schedule some action, like stop monitoring this instance and archive its data (just in case we want to perform some post-humous analysis later), without having to wait for the full TTL to expire. Basically we're saying, we haven't heard from you in a while, let's call your address and see if we get a response from the concierge. If we do, we'll give you a bit more time to respond personally but if not, we'll assume you left all together.
State
Let's have a look how we maintain this information. We start by creating a service definition for our application - in Zabbix, this is a simple as creating another host without a specific IP address and with only derived metric items (although, you could also give it a VIP address of some load balancer, should you want to aggregate some additional service checks). In the example below, our "service" is Consul, and we aggregate all the metrics from each node in the {$SERVICE_HOSTGROUP} host group, where the {$SERVICE_HOSTGROUP} macro is set to "Consul Nodes" (one of the host groups we add each instance to when it auto-registers).
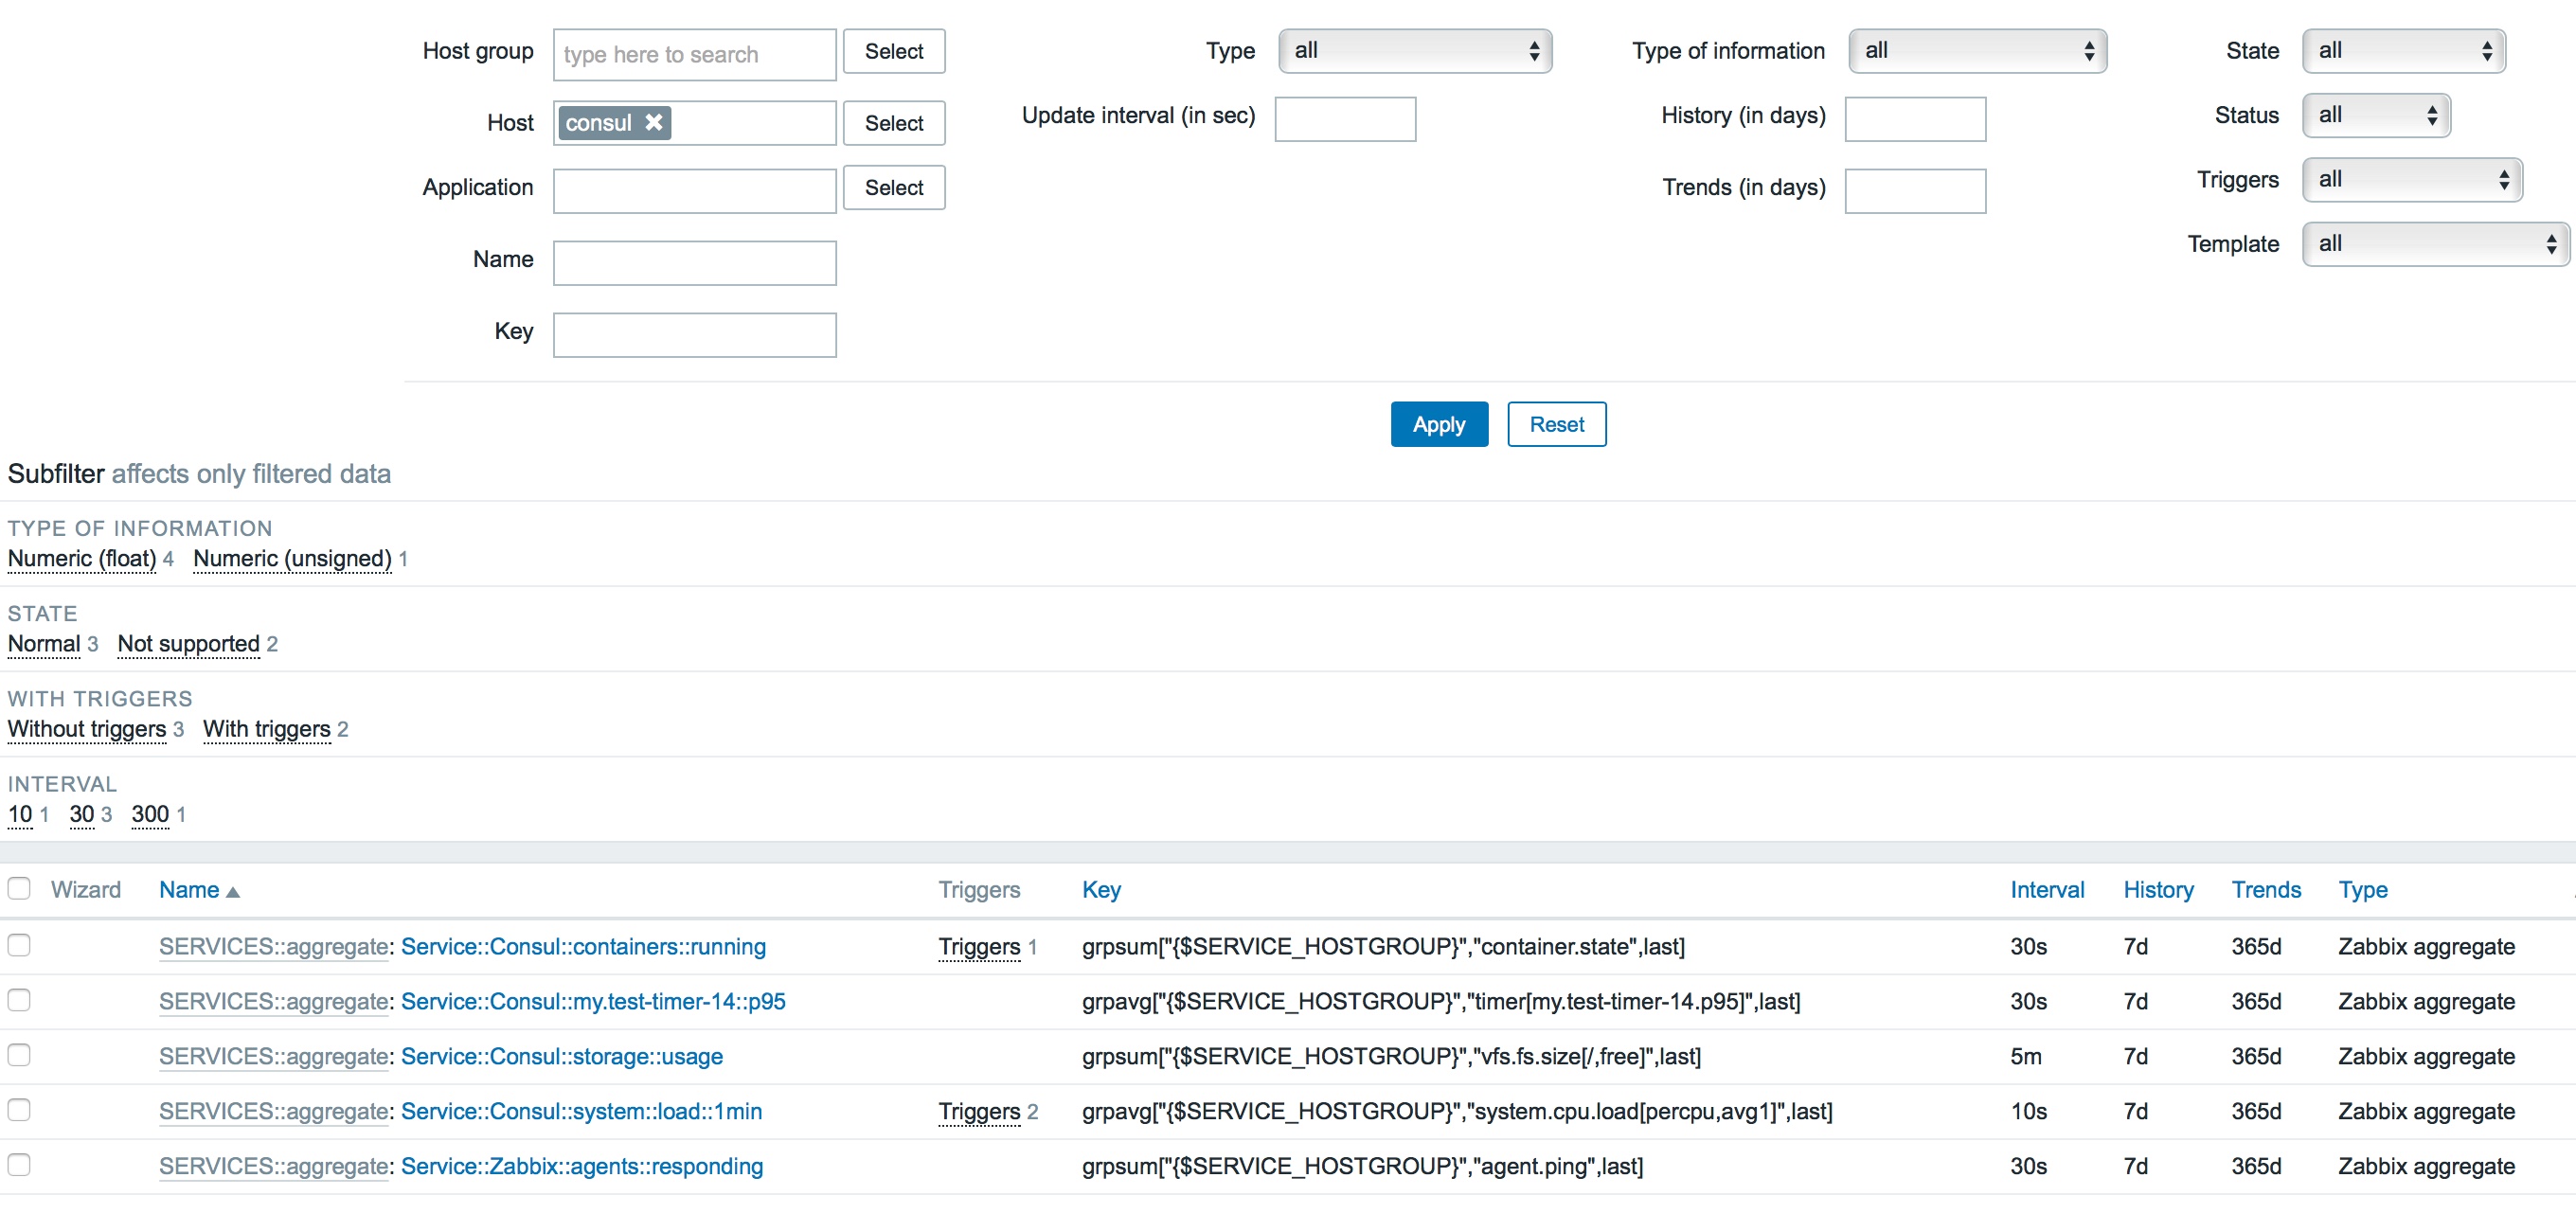
What were doing here is creating a set of aggregated metrics from across the "Consul Nodes" host group. 3 which sum (grpsum[]) the the last recorded values from each instance in the group and 2 which average (grpavg[]) the last result. The containers::running and agents::responding items are both used for understanding the state of running applications in the cluster and their value is passed to our scheduling script to work out the target number of instances required when we want to scale up or down.
Scaling
Auto-scaling profiles usually require setting conditions on one or more metrics. Then upon matching the condition, some action is performed. Usually, add or remove instances. Most event management systems have had this feature built in for many years. In Zabbix this is done by putting triggers on our metrics which, when fired, perform some actions. For example:
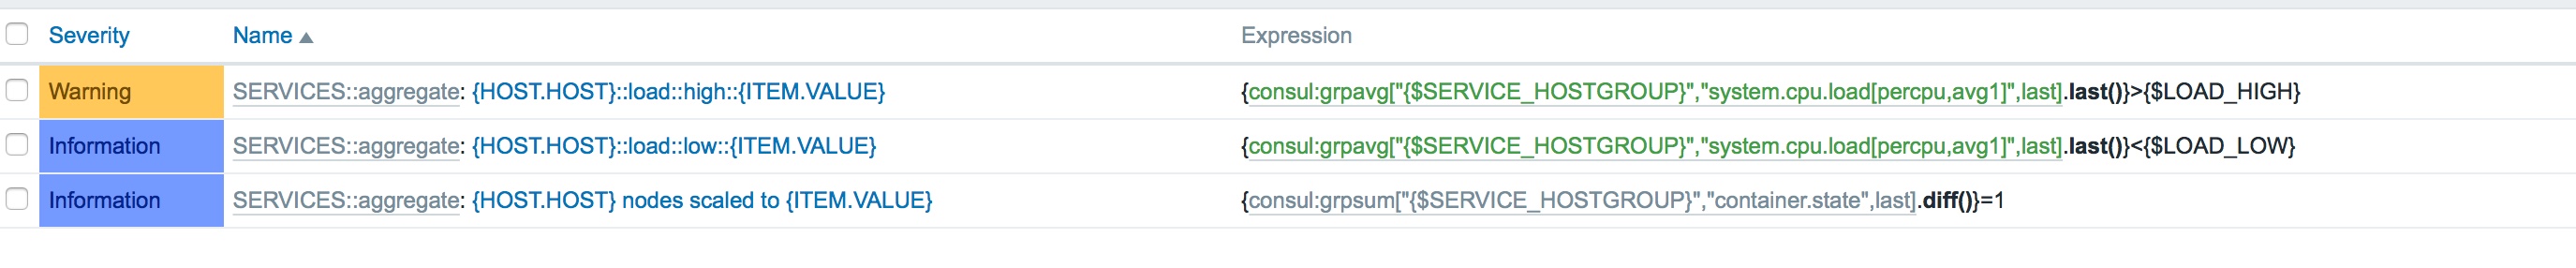
On the metric which is tracking the average load across the cluster (system.cpu.load[]), we've put two triggers. One when load is high and one when load is low. We can then use these trigger points for knowing when we need to be scaling up and when we need to scale down. However, because event management systems have evolved this facility over many years, we usually have the ability to create highly detailed conditions. Such as:
- If CPU utilisation is high, scale up by 1 instance but if CPU utilisation AND some queue depth is high, scale up by 3 instances
- Perform vertical scaling of the containers instead. E.g. If cpu is low but memory is high, just resize memory.
- Triggers could use escalation steps to keep adding more instances until trigger state = OK
- We could compare one of these triggers against some upstream service, like DB performance
- Perform some pre-scaling using a predictive trigger
- And any combination of these means that the possible scaling rules are vast.
We then need to add some actions and link them to triggers and our scheduling script (ignore *UNKNOWN*. This is because we like to include the last value in our trigger name/alert messages but when templated, there is no value to interpolate)

Here we have two actions, one on low load for scaling down and one on high load. Each of these actions runs when the linked trigger fires and the operation it runs is our remote script (below).]
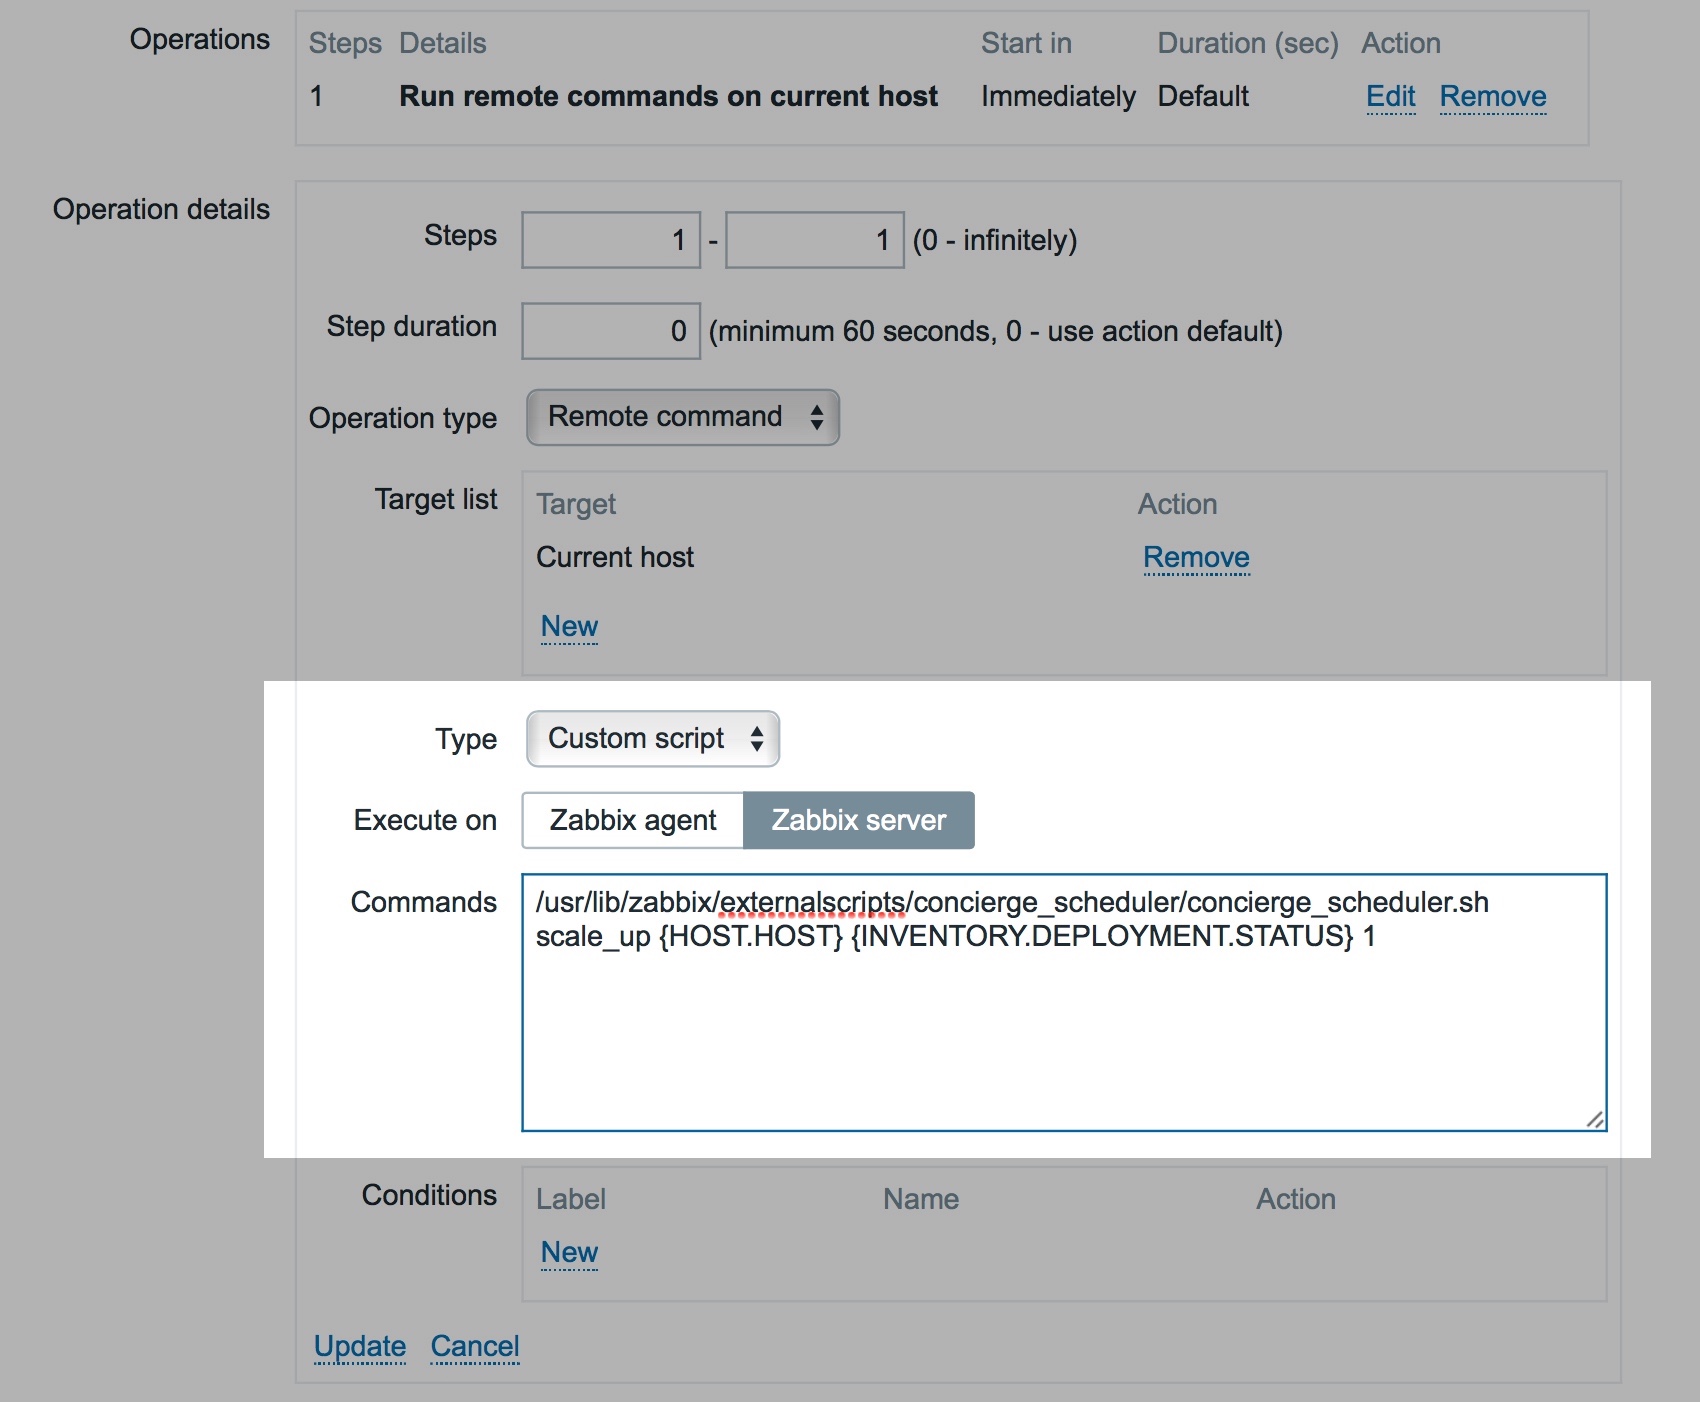
So when the trigger fires, run our custom script from the Server (there is no agent interaction with a dummy "service host") and pass it a scale_up command and some variables ({INVENTORY.DEPLOYMENT.STATUS} macro is automatically set in the inventory by the SERVICES::aggregate: Service::Consul::containers:running item and will be the current number of running containers for this service. {HOST.HOST} will pass the service name - consul - which is our dummy host name).
The Concierge Scheduler Script
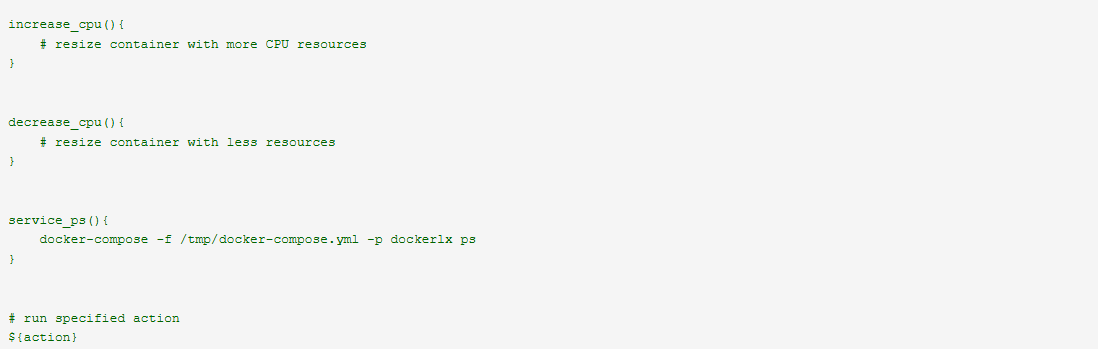
The Concierge acting in the role of concierge_scheduler.sh is taking a request from its client to manage their business schedule. As such when some particular resource gets low, order some more; and when something is no longer being used, get rid of it. Below is a simple example of what the script could look like:
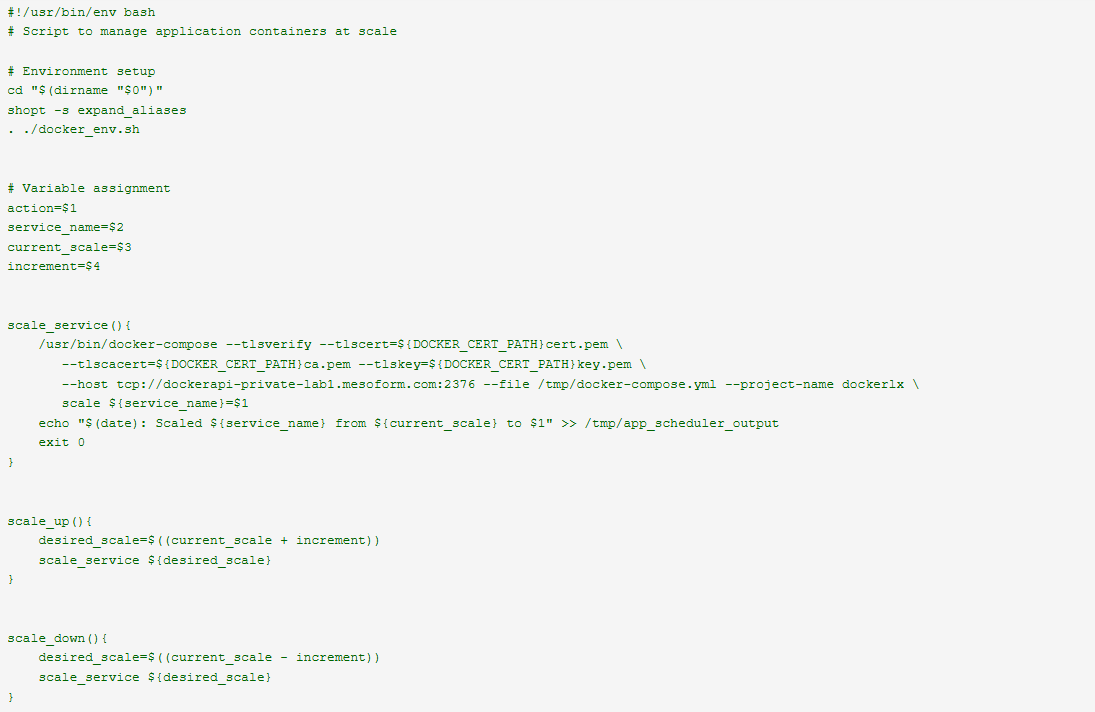
With container infrastructures, like Joyent's Triton, that manage placement of containers and allow containers to be first-class citizen's on the host and network, simply running docker-compose will be fine. However, when running containers on other infrastructures you may need to perform a little extra work to set up Docker Engine in Swarm Mode and scale services using docker service.
Conclusion
As with anything new, there were a number of issues along route that weren't considered initially. Things like how to tell Docker what the target number of instances should be when scaling up and down (because you don't tell it to +1). So we needed to find a way to extract the current number of running instances value out the DB and pass it to the scheduler script so it could work out what number to run. Overall though, the results have been really exciting because with this paradigm, we're not really doing a great deal more that we were doing already but gaining quite a lot. Let's summarise some of them
- We already have a monitoring system that handles events, so don't have to build anything new
- We're already auto-registering our current VMs and bare-metal machines
- We're already aggregating metrics from groups of hosts
- We're already performing actions on triggers. Like alerting and notifying people by Slack or email
- If we include scheduling into this same event stream, automated events, like scaling, can more easily be associated to incidents
- Our monitoring system already contains a lot of the state of our system as a whole.
- Now we're simply using that information to control the state
- Monitoring systems are already highly optimised for this sort of work and have been enterprise grade for a long time
- Our monitoring systems are often already a metric-central view of our whole system
- Self-healing is ready, pretty much out-of-the box
- Runtime changes are trivial and automated
- On-ramp is really short because there is very few new things to learn and build
- We gain more benefits of both Push and Pull methods of monitoring
- Accuracy and performance of monitoring microservices is greatly improved.
What's next
We will create a github repository with Ansible playbooks for spinning up an example environment on your laptop with all the necessary basic requisites. On the Zabbix server side you'll just need to perform a few extra steps manually until then. If using Zabbix, you'll need to create:
- An Enfield Method template and add to it:
- a discovery rule
- some item prototypes
- a static item for collecting metrics
- triggers on this item
- A Docker template and add to it
- a static, trapper item to receive heartbeat messages
- a TTL trigger on it
- An application or Cloud layer template which
- inherits from an OS template, Zabbix Agent template, the Enfield Method template and a Docker template
- has triggers on it that cross different metrics, like agent.ping and container.state
- Some relevant host groups
- An auto-registration rule that assigns new instances to these templates and host groups
- A service host and any templates for common items. Again with
- items and triggers
- Some actions from the service triggers to scale your services
If you have any questions you can contact us directly or on LinkedIn and Twitter
