JIRA was already being used company wide for tracking software development; change, problem and incident management so some time was invested into how we could organise our operational project work to solve the some of our problems.
For clarity, when talking about JIRA Projects, I'll use a capital letter and for projects in the normal definition, I'll use lowercase
Our Objectives
We wanted to solve as many of the following as possible:
- Have a top level description of the business value
- Have a road map level of milestones that would direct us to the final goal. This level would often be thought of as MVPs
- Separate team Projects where they could manage their own pieces of work needed to reach the next milestone
- Kanban or Scrum boards for each team
- A way to estimate and track time against our estimates to improve time management and priorities
- A way for each team to report on their weekly progress
- Provide a weekly report to senior management on the overall progress of projects
- Keep all of this as effortless as possible
Structural Foundation
THE WHO
In this instance, I'll just highlight the Operations vertical but the Business Value Project links into other roadmap Projects, like Development, QA and InfoSec as well. The main teams working on these were:
- Infrastructure and security
- QA
- Reporting
- Internal IT
- Systems
- Databases
- Applications
- Technical Operations Centre (TOC)
JIRA PROJECTS
Each team had their own JIRA project to work from:
- INFRA: Infrastructure and security
- QA: QA team project
- ITDEV: Internal office IT team project (like JIRA development)
- SYS: Systems team project
- DB: Databases team project
- APPS: Applications team project
...Plus there was also projects for managing the flow of work. They were:
BUSVAL: Top level objective
The main company objectives, whether that was an internal project (usually a technical decision) or a business project due to some customer request. MVPs for any given project could be defined in sub-tasks if needed and departmental roadmap projects would be linked to either these (or the main JIRA for small projects).
OPRO: Operations roadmap
We broke our company projects into 8 week cycles. We called them pulses but they were essentially Agile Epics that were then, each broken down again into Sprints of 2 weeks. We used the roadmap projects (OPRO in the case of Operations) to cover this and had them as JIRA Epic issue type so that they could be used on Scrum boards.
Doing this also allowed management and team leaders to meet regularly for pulse planning and more easily highlight dependencies across teams, change the directions of the sprints and assign time from engineers to work on cross-team pieces of work.
PROB: TOC problem management project
Problem investigations for sensitive technical troubleshooting. Complex investigations would be sub-tasked out to different teams and managed by the TOC.
INC: TOC incident management project
For tracking incidents (mainly notifications and performance reporting) raised internally and by customers. Managed by the TOC and Customer Partnership Managers.
CR: Change record project
Records of changes that had or would happen on production. Depending on their priority they were to be raised either manually and automatically by continuous deployment systems.
Sprints
JIRA has an Agile plugin (previously called Greenhopper) which we used extensively and structured our projects in it as follows:
Output
Getting this information into a more easily digestible format is easy through JIRA and Confluence integration. Confluence has a JIRA macro for embedding issue details into a wiki page.
Filters
First of all you'll need to create some filters that will be ran automatically when the report page is opened.
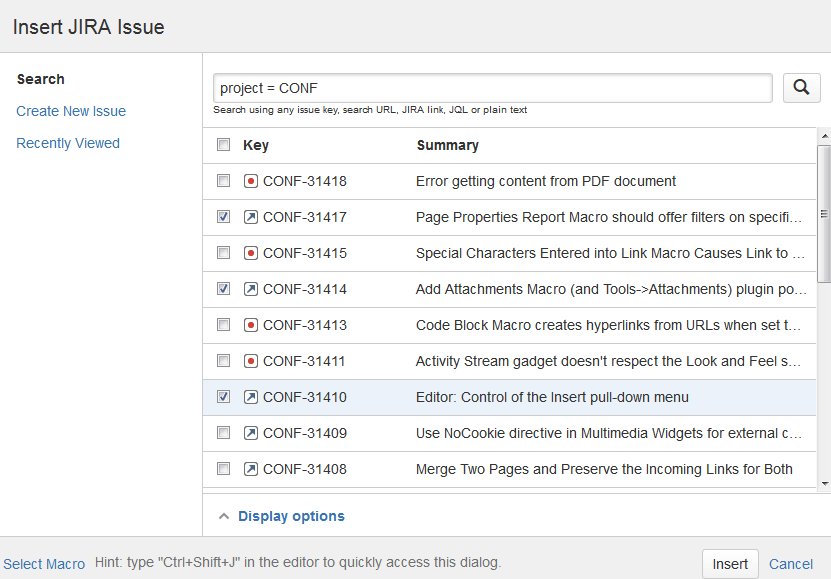
- Open the macro chooser in the Confluence editor by selecting Insert > Other Macros and search for and select JIRA Issues
- You will then get a window that looks like this

- Enter the filter that you created earlier in the search field
- Once you have your results, select display options and choose the fields, and their order, to your needs.

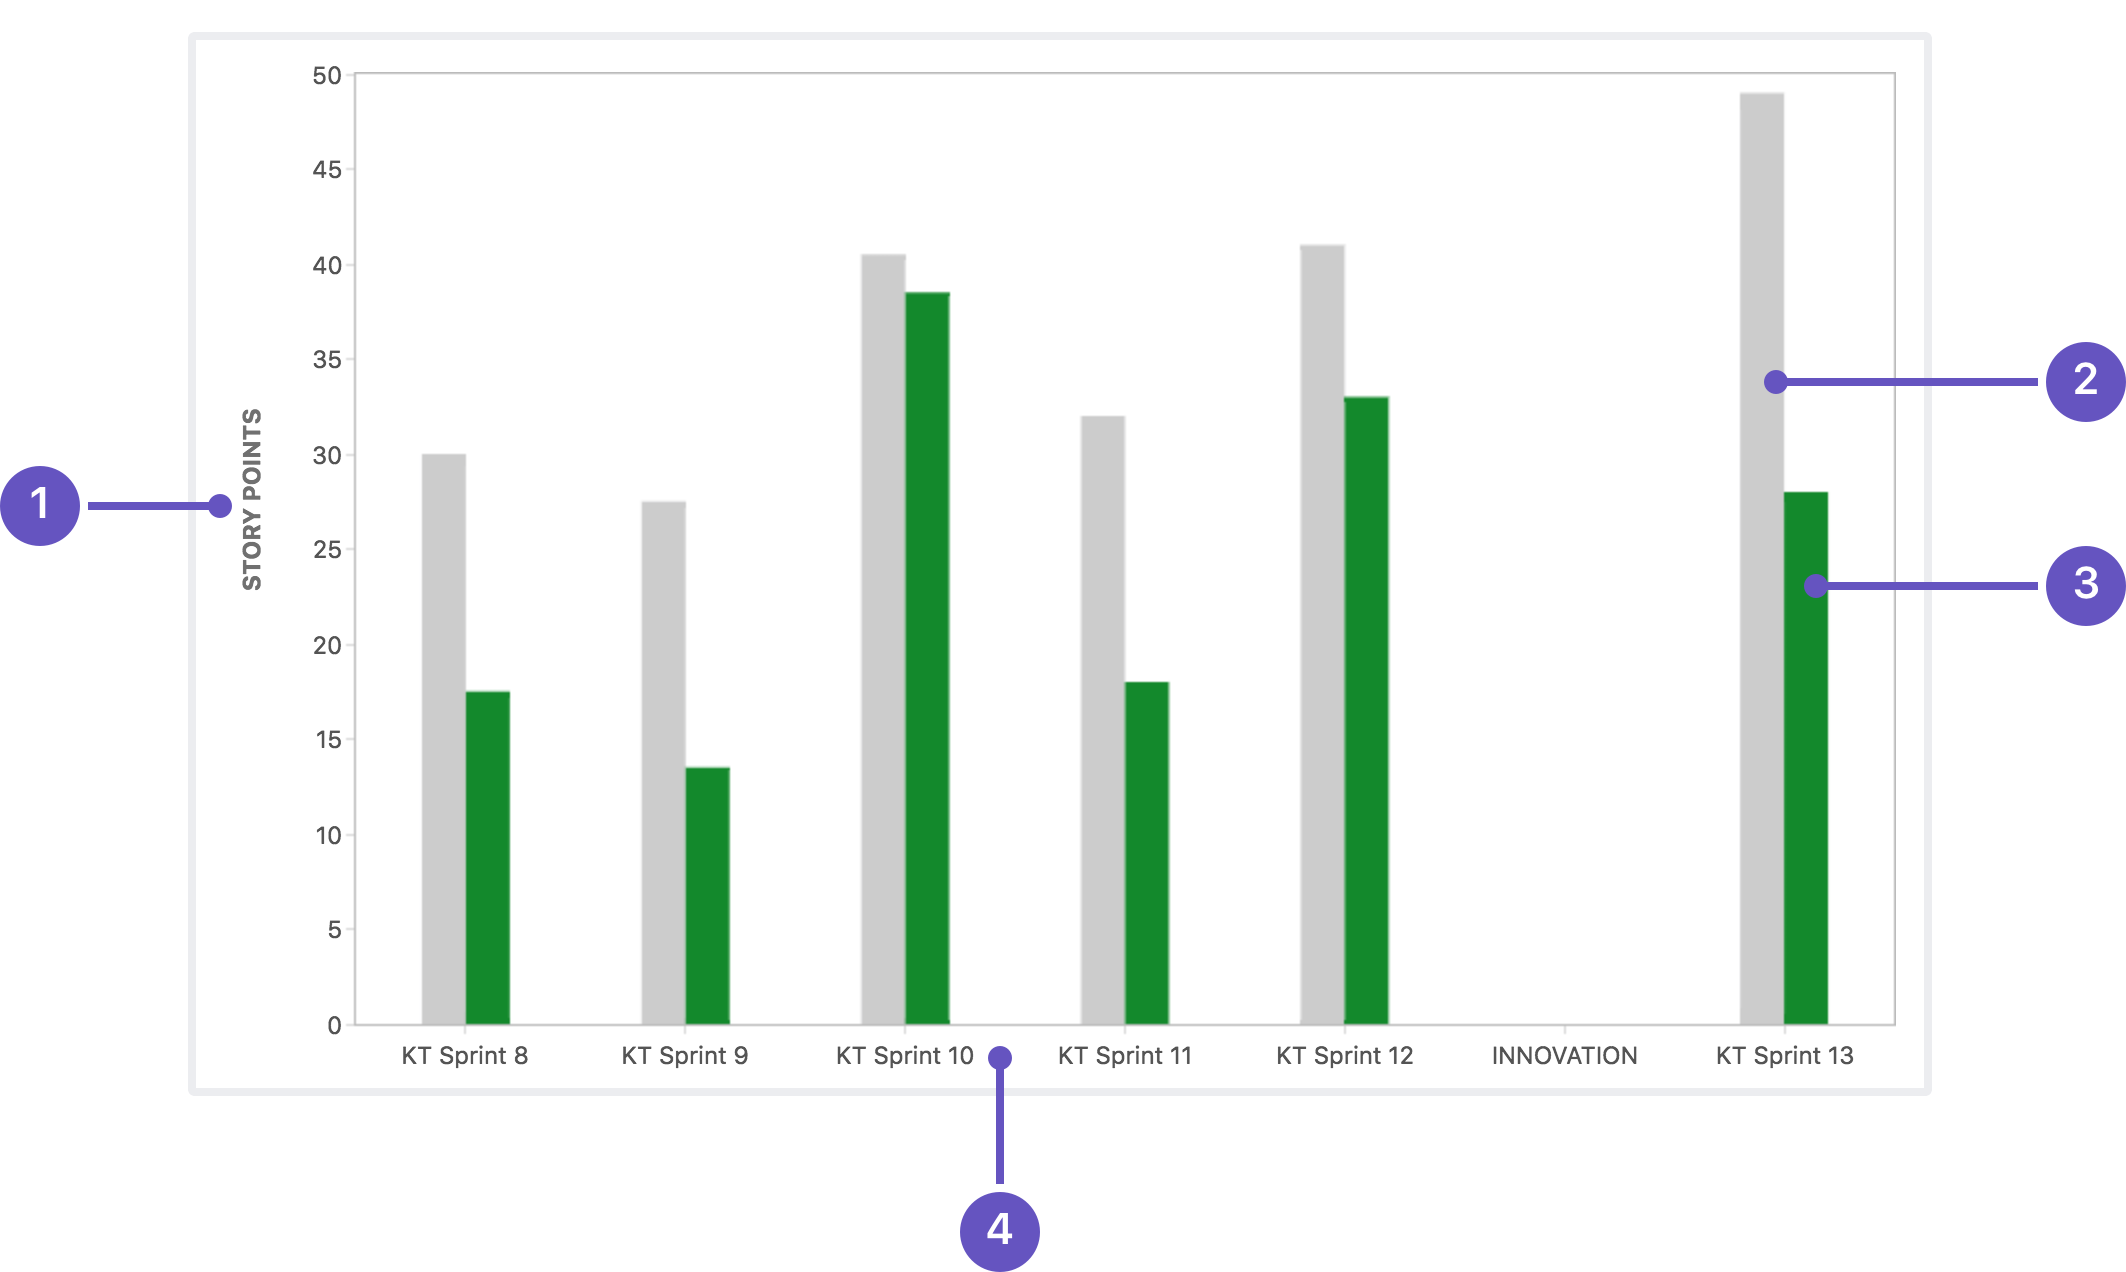
- For embedding statistics on performance, it also has a chart macro that brings in visualisations like what would be enabled in a JIRA dashboard.
- Take a look at the attached report for an example of the sort of things that can be presented.
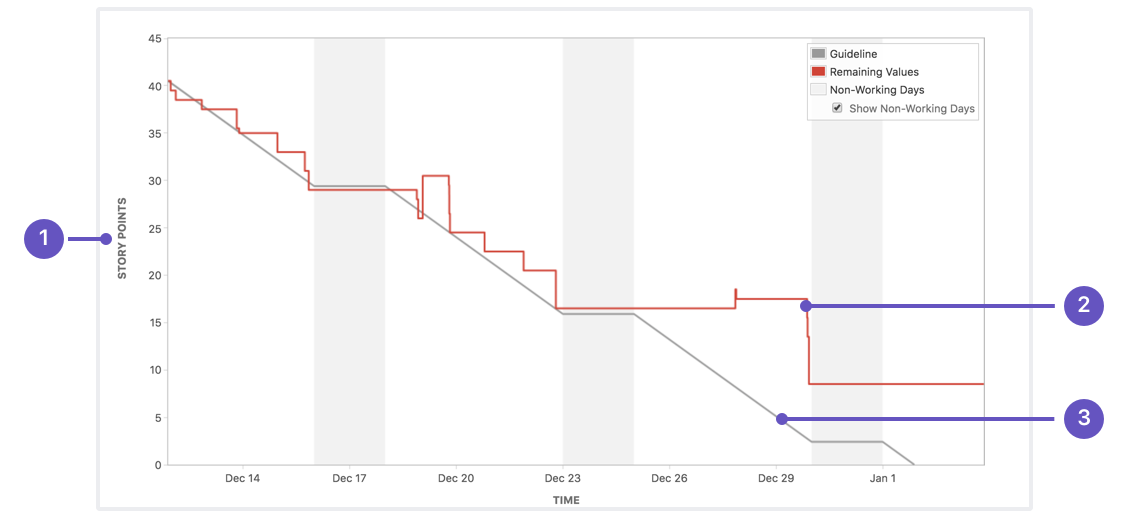
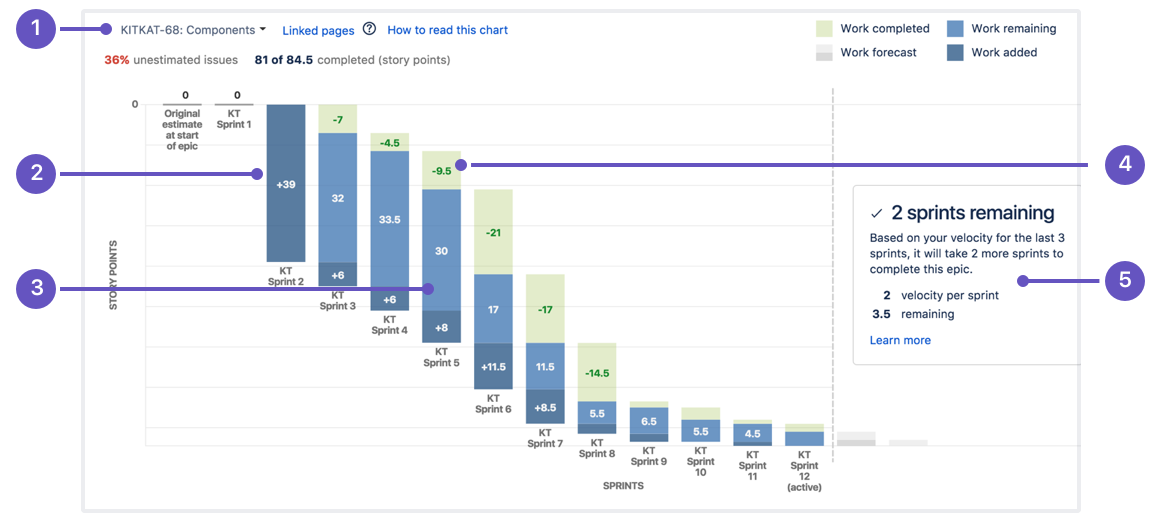
Beyond presenting reports in Confluence and exports to PDF, JIRA comes with a whole suite of available metrics that help you to increase your output. You just need to use it right. For example, we can automatic burndown and velocity charts by simply nudging engineers to keep their tickets updated. In model above, we get this at the sprint and pulse view.


Conclusion
This simple configuration allowed us to meet all of our objectives:
Have a top level description of the business value
We have a BUSVAL project where we the original company vision and direction that programme managers and executives need is kept meaning that tracking this high level progress is easy.
Have a road map level of milestones that would direct us to the final goal. This level would often be thought of as MVPs
Our OPRO (and others) project allowed us to forward plan what our MVP would be and engineers also had a better idea of what the overall goal for their story was. This meant that team managers, project managers and scrum masters had a place where they can report on week-by-week and sprint-by-sprint progress when working towards the business value (BUSVAL) goal
Separate team Projects where they could manage their own pieces of work needed to reach the next milestone
Having separate projects for each team meant that work could be done in isolation but still linked to the cross-project epics in the roadmap project (OPRO). It meant that each team could have a personalised kanban/scrum board but still have access to a higher level cross-team board in the OPRO. Permissions to these projects can also be better controlled, so in the case of wanting to control who has access to potentially sensitive information, individual projects make this easier.
Kanban or Scrum boards for each team
covered by the last point
A way to estimate and track time against our estimates to improve time management and priorities
At each level (team, roadmap and business value), automated Agile charts (like burndown or velocity) are available in standard JIRA reports and dashboards, so everyone has just the right information that they need. Having Roadmap (Epic) management JIRAs set to cycle every 8 weeks also meant that dependency planning became easier across teams to give better estimates on milestone completion dates.
A way for each team to report on their weekly progress
At each level (team, roadmap and business value), automated reports are available in standard JIRA reports, so everyone has just the right information that they need. These reports can easily be embedded in Confluence and exported to another format.
Provide a weekly report to senior management on the overall progress of projects
One useful thing we did was add a weekly/sprint report custom field to our JIRAs. This made it easier to provide weekly status updates because trying to use commentary, unless carefully controlled, these updates can quickly become overwritten by someone adding a more recent comment. We used these fields when embedding filters into Confluence pages (see attached document)
Keep all of this as effortless as possible
By creating filters that used resolution times, sprint values, and other time based values, we could auto-populate our our confluence page reports using the JIRA plugins available. This made 8-10 hours worth of report writing cut to 1-2 hours. This information was always up-to-date and readily available to anyone who needed it.
Additionally
As a side effect of making these changes we found that it then enabled us to embed operations engineers more easily into development workstreams and therefore share knowledge both internally and across teams more easily. So we then set in motion cross-team scrums where operations' engineering time was allocated to a particular value-driven project as-and-when required. A real service-oriented organization
This gave me my weekend back and made me very happy!!


